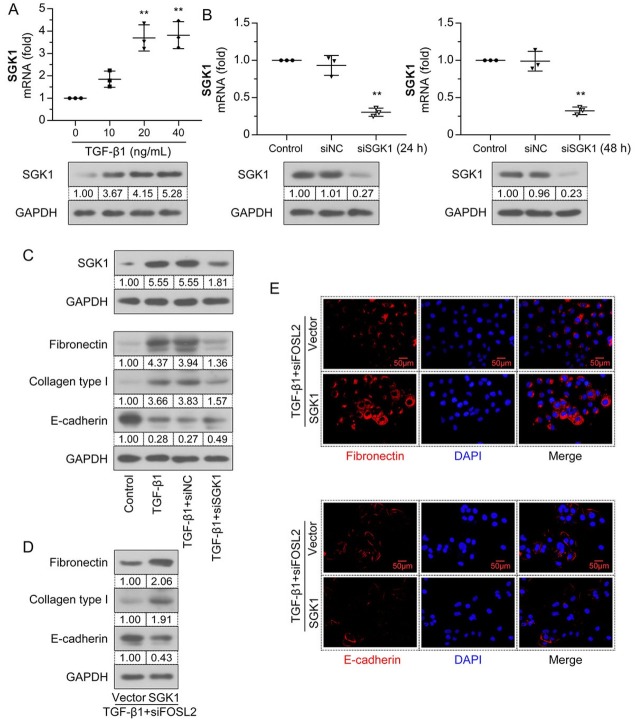
Figure 8.
FOSL2 promotes TGF-β1–induced fibrotic transformation in HK-2 cells through SGK1. (A) The mRNA and protein expression levels of SGK1 in the HK-2 cells treated with different concentrations of TGF-β1 were analyzed by qRT-PCR and western blotting analyses. (B) The interfering efficiency of siSGK1 was detected by qRT-PCR and western blotting analyses at 24 h and 48 h. (C) Western blotting analyses of the total protein expression levels of SGK1, fibronectin, collagen type I, and E-cadherin. (D) Western blotting analyses of the total protein expression levels of fibronectin, collagen type I, and E-cadherin. (E) Representative micrographs show fibronectin and E-cadherin expression in TGF-β1–treated HK-2 cells. Magnification: 400×. Scale bar: 50 μm. The values are expressed as mean ± standard deviation. **P < 0.01 versus control or siNC group. qRT-PCR: quantitative real-time polymerase chain reaction; TGF-β1: transforming growth factor-β1; SGK1: serum/glucocorticoid regulated kinase 1.

