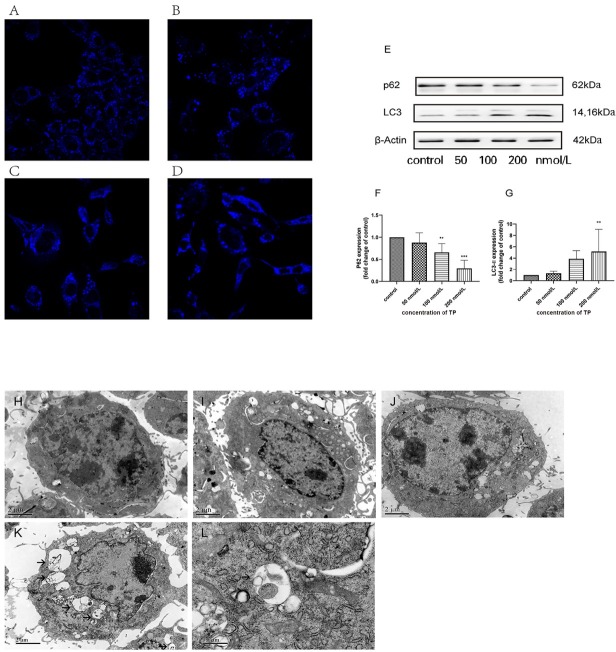
Figure 4.
High concentration TP triggers autophagy in TM3 cells. A–D. To characterize autophagy, we used MDC staining to observe the acidic compartment in TP-treated TM3 cell. Cells were treated with various concentration for 24 h, (A) control, (B) 50 nmol/L, (C) 100 nmol/L, (D) 200 nmol/L. E. Expression of autophagy-related protein following treatment with TP (50, 100, and 200 nmol/L) for 24 h. F–G: Bar graphs are representative of three independent experiments. (**P < 0.05,***P < 0.01 vs. control group, n = 3). H–L. Ultrastructural evidence of TP-induced autophagy of TM3 cells. TM3 cells were treated with control (H), 50 nmol/L TP (I), 100 nmol/L TP (J), 200 nmol/L TP (K) for 24 h. Autophagic vacuoles were visualized using TEM (12,000× magnification). L. The classic structure (15,000× magnification) treated with 200 nmol/L TP. The autophagic vacuoles are indicated by arrows. Scale bar: H-K=2 μm, L=0.5 μm. TP: triptolide; TEM: Transmission electron microscopy.

