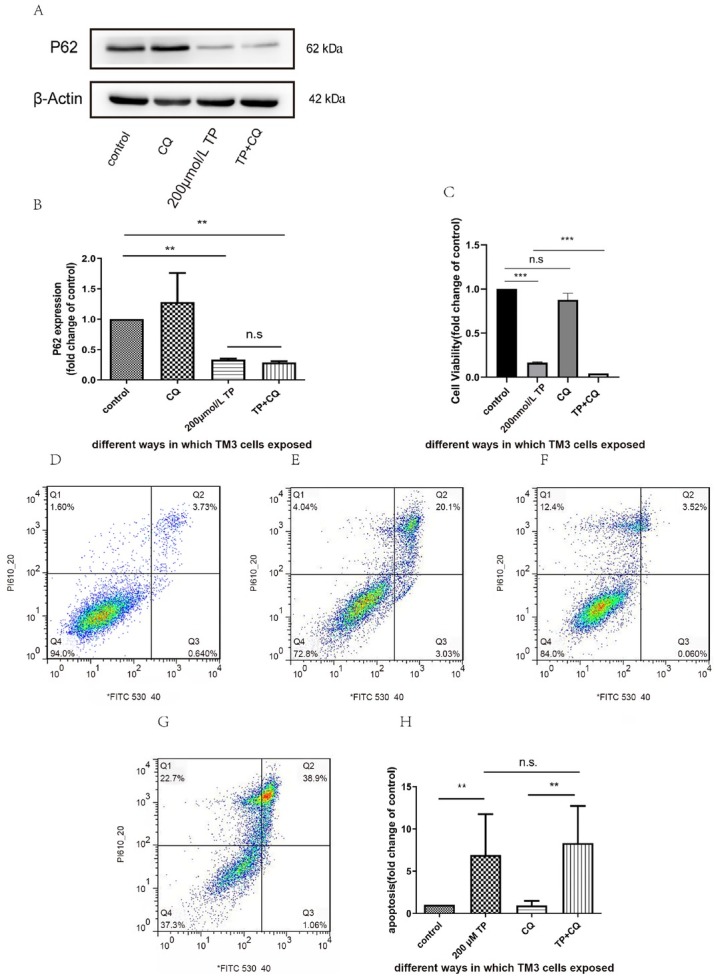
Figure 6.

Effects of CQ on TP-induced apoptosis. A–B: TM3 cells were pretreated with 50 nmol/L of CQ for 1 h, followed by 200 nmol/L TP treatment for 24 h. Western blot analysis and relative densitometry of P62 protein. Values are expressed as fold mean ± SD. C: Cell viability was measured using the CCK-8 assay. The results are presented as mean ± SD. D-H: TM3 cell were stained with Annexin V and propidium iodide, and the apoptotic was determined using flow cytometry (D: control, E: 200 μmol/L TP, F: CQ, G: TP+CQ,H:Bar graphs were representative of three independent expriments). The results were presented as mean±SD. **P ﹤ 0.05, ***P ﹤ 0.01 vs. control group, n = 3. CQ: chloroquine; TP: triptolide. n.s: no significant.
