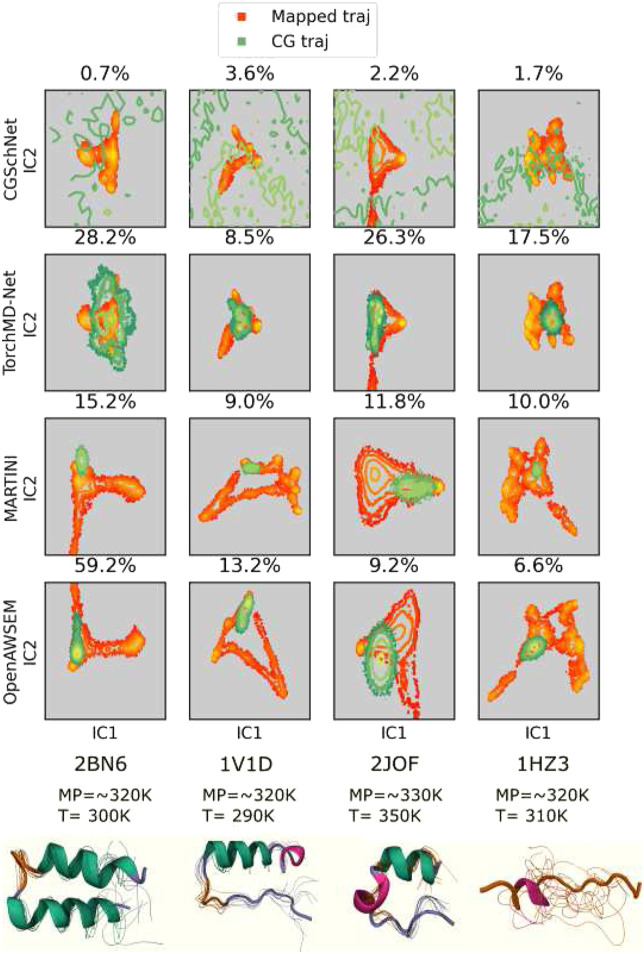
FIG. 3.
Mapped and CG FES from FF0–FFs trained with all four states. Top: projected miniprotein mapped and CG trajectories from CGSchNet, TorchMD-Net, MARTINI, and OpenAWSEM FFs. Total variation similarity (TVS) between the mapped and CG FES is annotated as a percentage. Higher TVS indicates higher similarity. Bottom: cartoon representations of miniprotein reference trajectories annotated with approximate melting and simulation temperatures. P-element somatic inhibitor miniprotein (PDB ID:2BN6), Miniature Esterase (PDB ID: 1V1D), Trp-cage miniprotein (PDB ID:2JOF), and β-amyloid peptide residues 10–35 (PDB ID: 1HZ3) were used in this study. Conformational ensembles are 20 random frames after a weighted iterative alignment following the procedure of Ref. 100.

