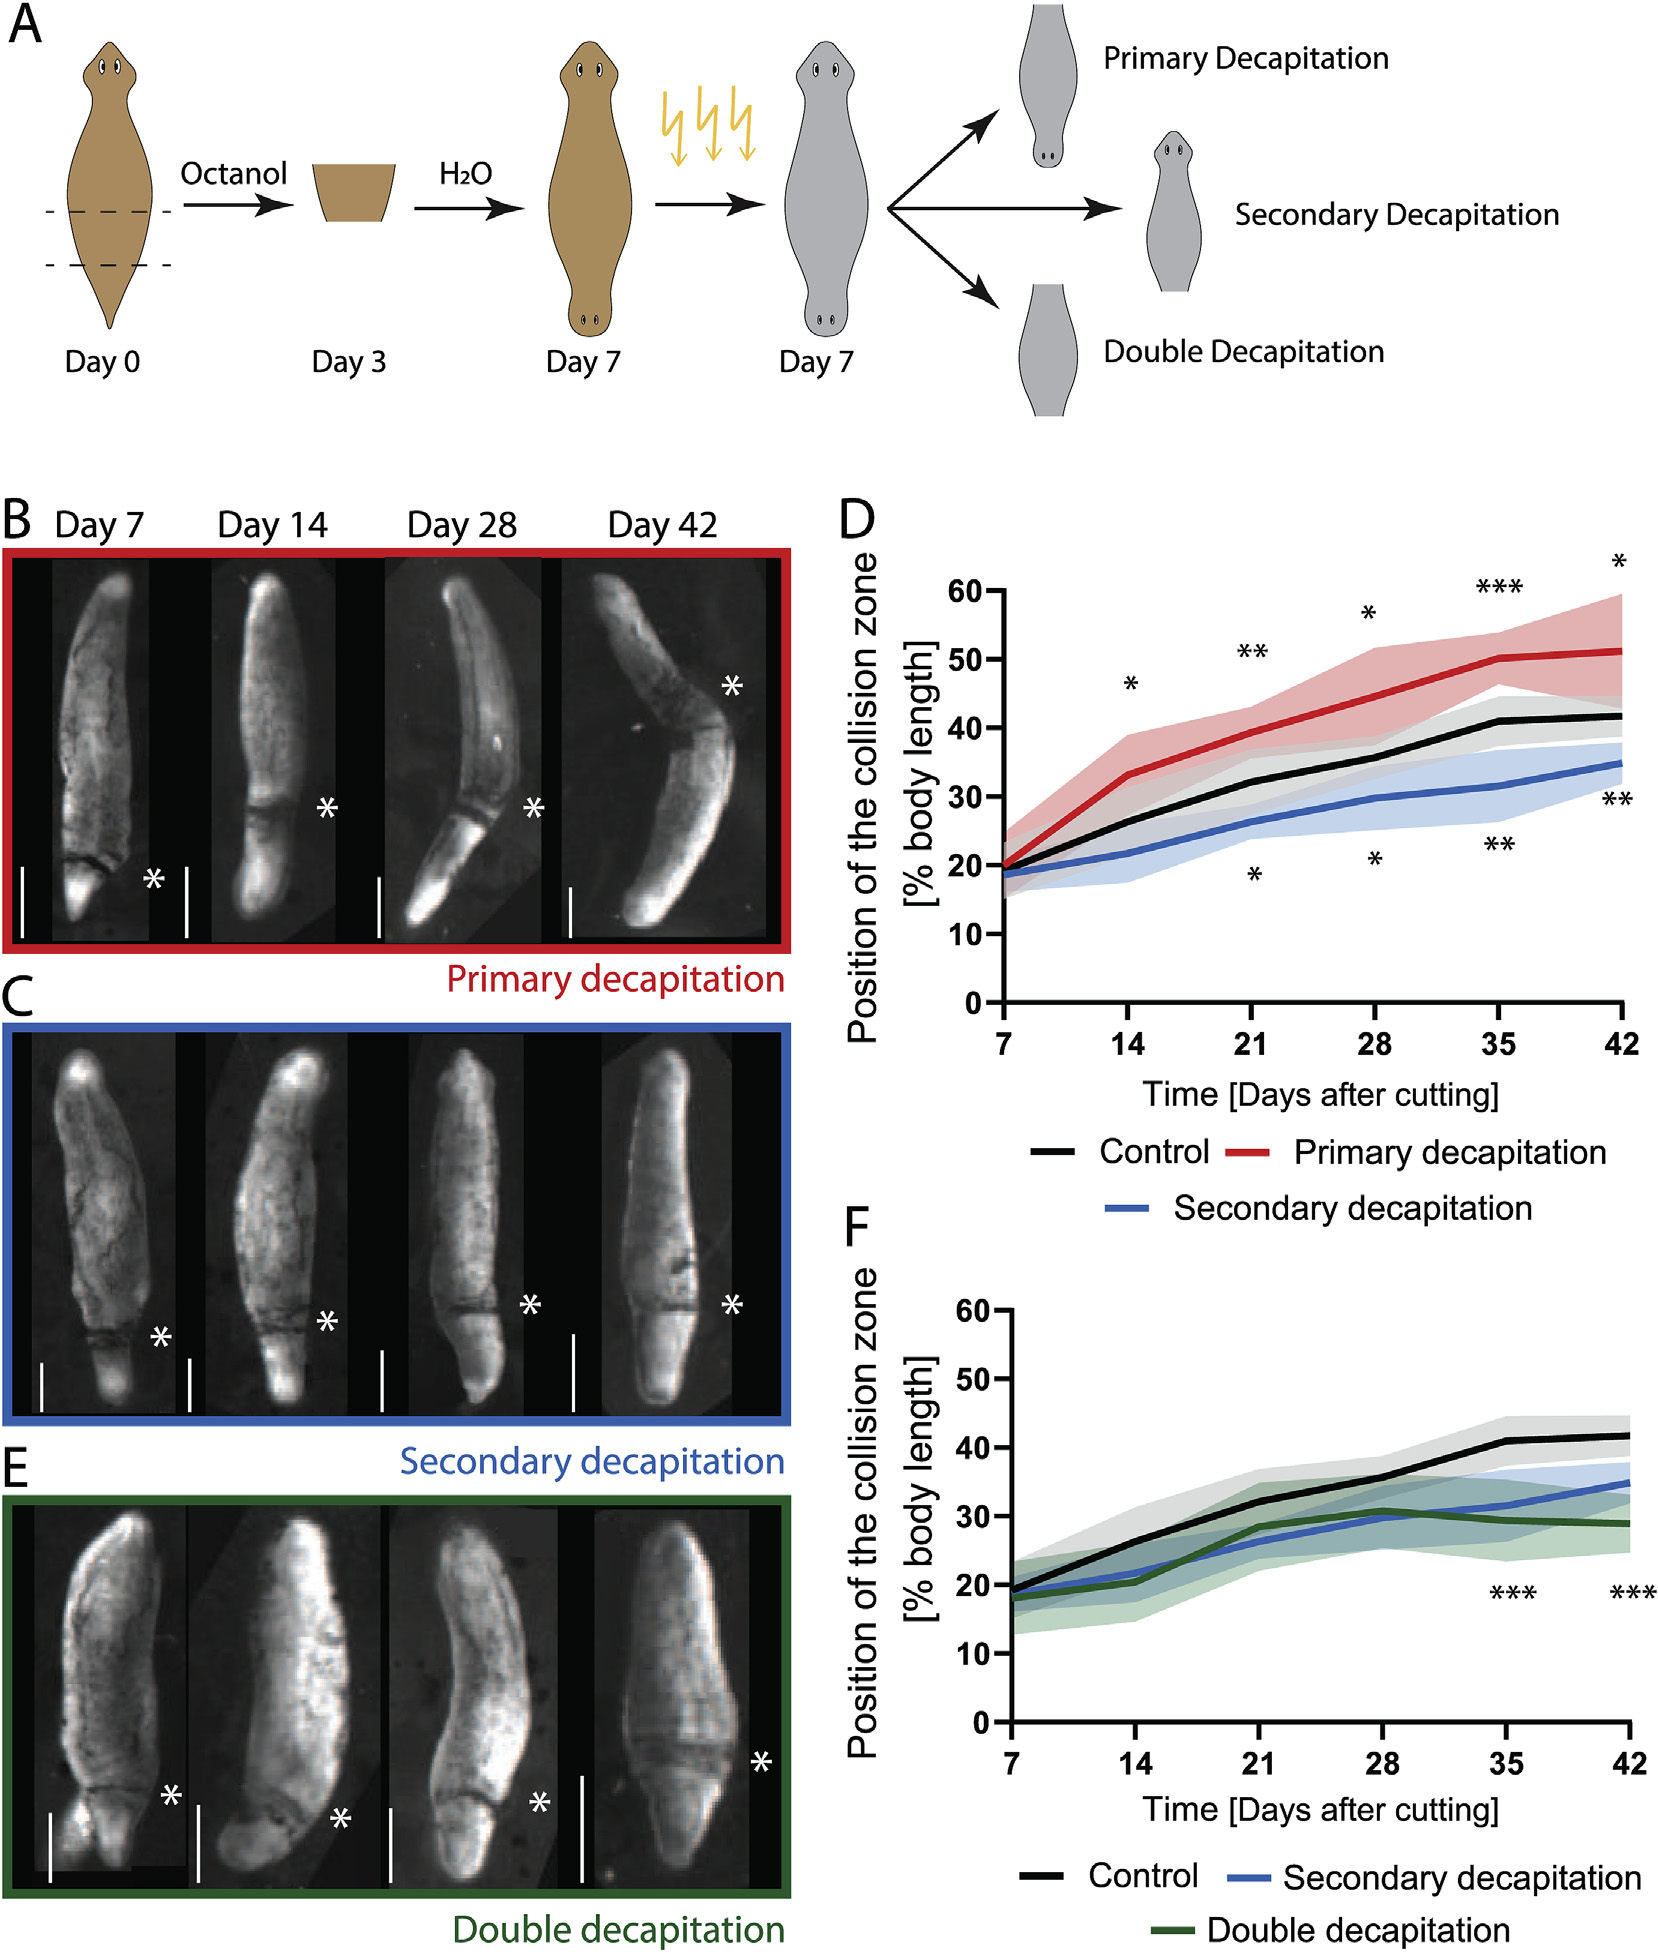
Fig. 3. The presence of the heads controls cilia reorientation.

A) Experimental scheme showing induction of DHs by Octanol treatment, followed by irradiation at Day 7 and subsequent removal of either the primary, secondary or both heads. B) Position of the collision zone (asterisk) in DH animals, which were irradiated and decapitated at the primary head at Day 7, at Day 7, 14, 28 and 42 showing the advance of the collision zone across the midpoint at Day 42. C) Position of the collision zone (asterisk) in DH animals, which were irradiated and decapitated at the secondary head at Day 7, at same time points as above. D) Quantification of the position of the collision zone in control animals (black curve) and in animals with either the primary head (red) or the secondary head (blue) removed at Day 7 following irradiation. Removal of the primary head significantly speeds up cilia reorientation, while removal of the secondary head reduces the speed. E) Position of the collision zone (asterisk) in DH animals, which were irradiated and double-decapitated at Day 7, at same timepoints as above. F) Quantification of the position of collision zone in animal with both heads removed (green), compared to control (black) and secondary decapitation (blue). *p < 0.01, **p < 0.001, ***p < 0.0001. N = 12, with 2 repeats showing same pattern. The mean of all samples is plotted. Shaded area represents standard deviation. All experiments are paired with their respective controls. Scale bar 1 mm.
