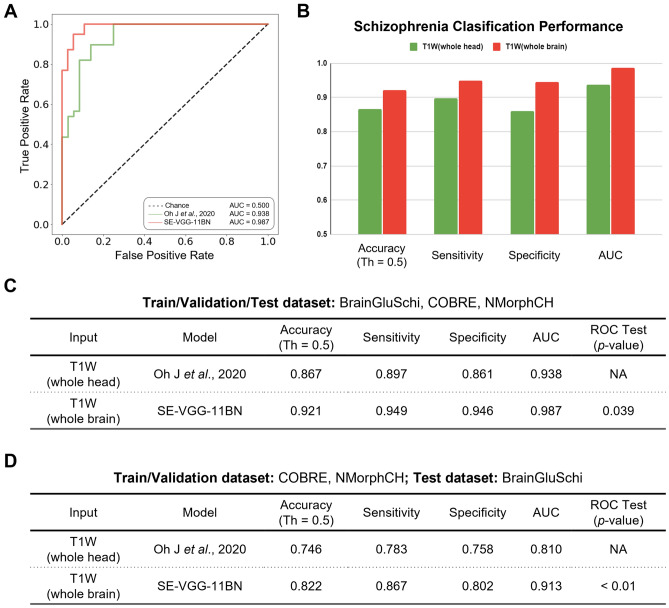
Figure 5.
Quantitative performance comparisons of our model and the benchmark model. (A) Receiver operating characteristics (ROC) curves for schizophrenia classification on the dataset. The green line represents the ROC curve of the benchmark model with the input of T1W WH scans. The red line represents the ROC curve of the SE-VGG-11BN with the input of T1W WB scans. (B) Bar plot of the classification performance of these models in terms of the accuracy (at the default operating threshold of 0.5, Th = 0.5), sensitivity, specificity, and the area under the ROC curve (AUC). (C) Table quantitatively summarizes the performance of these models. The p-value of the ROC test (DeLong’s test) indicated our model is significantly better than the benchmark model at a level of 0.05. (D) Generalizability of the two models trained by COBRE and NMorphCH datasets on unseen BrainGluSchi test dataset. Considering components A through D, SE-VGG-11BN exhibits a significantly better performance than the benchmark model.

