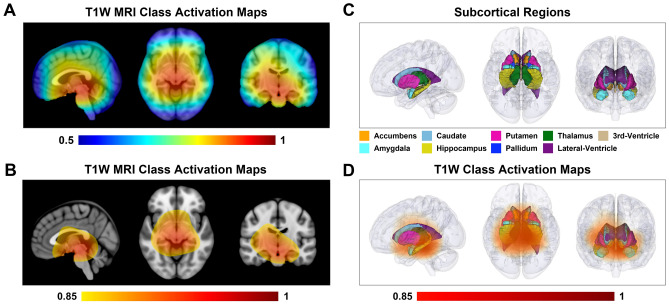
Figure 6.
Class activation map on T1-weighted brain MRI images in schizophrenia classification. (A) The class activation map (CAM) derived from feature maps in the last convolution layer from schizophrenia patients localizes the discriminative regions for schizophrenia classification in the sagittal, axial and coronal views. The color bar ranges from 0.5 to 1. The higher the value, the more important role the region plays in schizophrenia classification. (B) The CAM is displayed in the sagittal, axial, and coronal views with a threshold of 0.85. The color bar ranges from 0.85 to 1. The thresholded CAM primarily lies in the subcortical regions and ventricular areas. (C) Subcortical regions and ventricular areas are visualized in 3D in the sagittal, axial, and coronal views. (D) The 3D volume rendering of the thresholded CAM demonstrates the location of the most discriminative regions in the sagittal, axial, and coronal views. The color bar ranges from 0.85 to 1. The thresholded CAM covers the subcortical regions and the ventricular areas.

