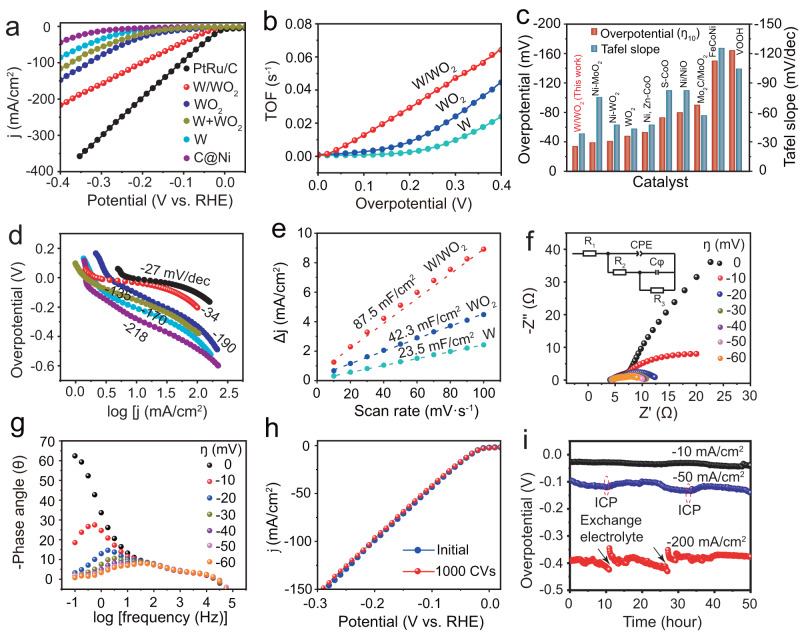
Fig. 3. The evaluation of HER performance of W/WO2 solid-acid catalyst in 1.0 M KOH electrolyte (pH = 14, Rs = ~4.0 Ω, mass loading = 3.2 mg/cm2).
a polarization (LSV) curves of C@Ni (wine red), W (light blue), WO2 (deep blue), W + WO2 (green), W/WO2 (red) and commercial PtRu@C (black) catalysts. b TOF plots of W, WO2, and W/WO2 catalysts at overpotentials of 0 ~ 0.4 V. c Comparison of overpotentials (10 mA/cm2) and Tafel slopes of W/WO2 solid-acid catalyst and previously reported excellent transition-metal-oxide based HER catalysts in alkaline electrolyte. d Tafel plots of C@Ni (wine red), W (light blue), WO2 (deep blue), W + WO2 (green), W/WO2 (red) and commercial PtRu@C (black) catalysts. e The determination of CdI by plotting the current density variation (Δj) against the scan rates (10–100 mV s−1). f Nyquist plots (the inset shows the equivalent circuit for the simulation) and g the corresponding Bode phase plots of W/WO2 solid-acid catalyst with the increase of applied overpotentials at 0 (black), −10 (red), −20 (deep blue), −30 (green), −40 (purple), −50 (light purple), and −60 (orange) mV. h LSV curves of W/WO2 solid-acid catalyst before (deep blue) and after (red) 1000 CVs. i Chronopotentiometry measurements of W/WO2 solid-acid catalyst at current densities of −10 (black), −50 (blue), and −200 (red) mA/cm2, and the red dashed circle indicates the extraction of electrolyte for ICP detection.

