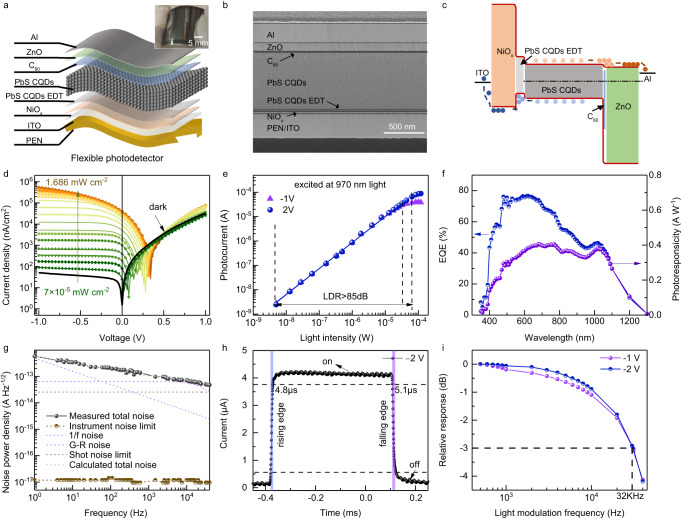
Fig. 2. Device performance of PbS CQDs photodiode under UV-Vis-NIR light illumination.
a Schematic diagram of flexible PbS CQDs photodiode. The inset is a photograph of flexible PbS CQDs photodiode array with a scale bar of 5 mm. b Cross-section SEM image of flexible PbS CQDs photodiode. c Energy band diagram of flexible PbS CQDs photodiode. d Current density–voltage curves under dark and 970 nm LED illumination with different power density. e Linear dynamic range at bias of −1 V and −2 V. f Broadband EQE and responsibility spectra at −2 V bias. g Measured and calculated noise current spectral density. The calculated limits of 1/f noise, generation-recombination (G-R) noise and shot noise are included. h Temporal response at −2 V bias illuminated by 780 nm LED with the power density of 0.1 mW cm−2. i −3 dB bandwidth at bias of −1 V and −2 V.

