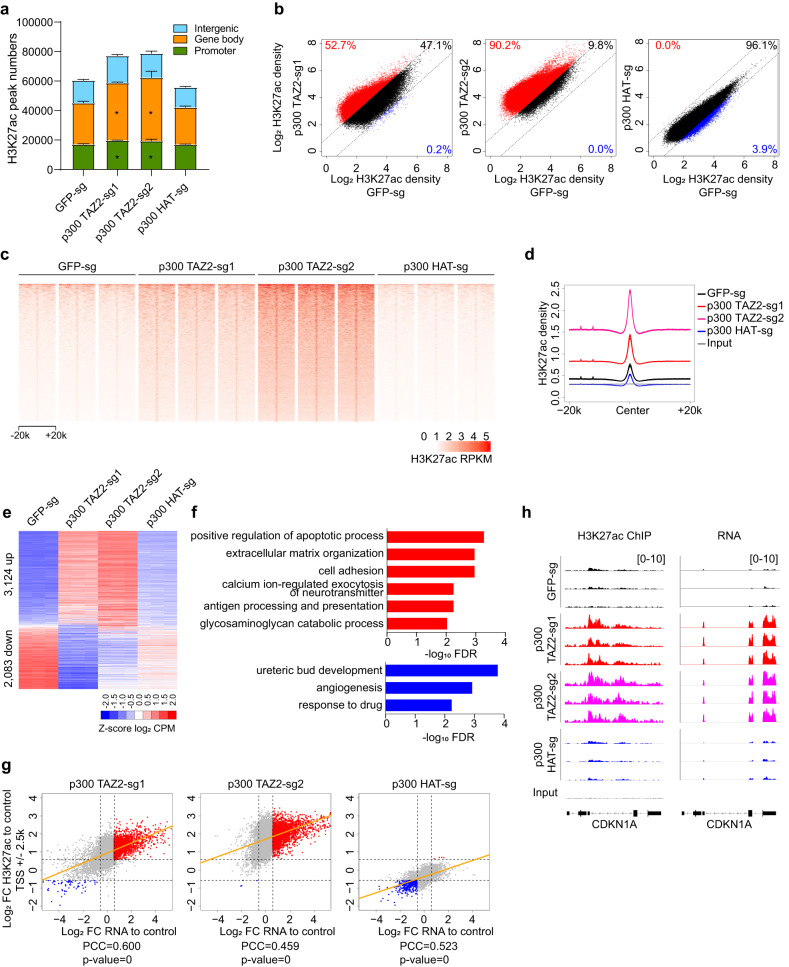
Fig. 2. Increased histone acetylation by p300 TAZ2 truncations is associated with enhanced gene expression.
a Bar plot of H3K27ac ChIP-seq peak numbers in OVCAR-3 cells expressing the indicated p300 sgRNAs and control GFP sgRNA. Error bars represent s.d. of 3 replicates. Asterisks indicate significant increase over peaks in the control cells (Two tail paired t-test, p-value numbers and details in Supplementary Data 2). b Dot plots of log2 read densities of H3K27ac ChIP-seq peaks from cells expressing p300 TAZ2 (left and middle) and HAT (right) sgRNAs compared to the control cells expressing a GFP sgRNA. Dot values are average of 3 replicates. Red and blue dots indicate relatively high and low H3K27ac signals (FC > 1.5), respectively. c Heatmaps of H3K27ac ChIP-seq densities centered on H3K27ac peaks across a ± 20-kb window in cells as in a. The color key represents RPKM signal density with darker color representing higher signal. RPKM: Reads Per Kilobase Million. n = 3 biological replicates. d Average profiles of H3K27ac ChIP-seq densities centered on H3K27ac peaks in cells as in a. e Heatmap representation of differentially expressed genes in cells as in a. Red and blue indicate relatively high and low expression (FC > 1.5 and FDR < 0.05), respectively (details in Supplementary Data 4). CPM: counts per million. n = 3 biological replicates. f Enriched Gene Ontology (GO) terms (FDR < 0.01) of up and downregulated genes in e (details in Supplementary Data 5). g Correlation between fold changes of promoter H3K27ac and gene expression. X-axis is log2 fold change (FC) of RNA expression and Y-axis is log2 fold change of promoter H3K27ac levels in cells expressing p300 TAZ2 (left and middle) and HAT (right) sgRNAs compared to the control cells. Red and blue dots represent genes with increased or decreased H3K27ac and expression (FC > 1.5), respectively. Orange lines indicate fitted linear models. PCC: Pearson correlation coefficient. h Integrative Genomics Viewer (IGV) views of H3K27ac ChIP-seq densities and RNA expression of CDKN1A in cells as in a. Three biological replicates of each cell line are shown. Source data are provided as a Source Data file.

