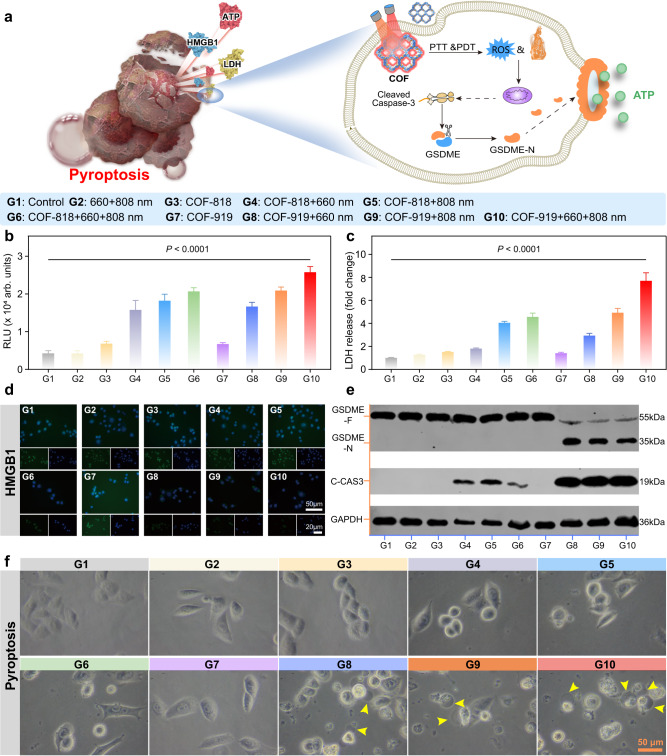
Fig. 5. Characterization of the pyroptosis-eliciting capability of COF-818 and COF-919.
a illustration of the mechanism of GSDME-dependent pyroptosis induced by COF-818 and COF-919. Quantitative evaluation of the representative pyroptosis factors, ATP (b) and LDH (c) in 4T1 cells after various treatments; data are presented as mean ± SEM (n = 3 independent samples). d Representative images of HMGB1 immunofluorescence staining in 4T1 cells after treatment with different samples. e Evaluate the expression levels of cleaved Caspase-3 and GSDME-N in 4T1 cells through western blot analysis; Western blot was done thrice independently with similar results. f Representative images of 4T1 cell morphology change after various treatments; the photographs of cell morphology were representative of those generated from three independent samples, each group with similar results; scale bar = 50 μm. Statistical significance was calculated via one-way ANOVA with Tukey’s multiple comparisons test. Source data are provided as a Source Data file.

