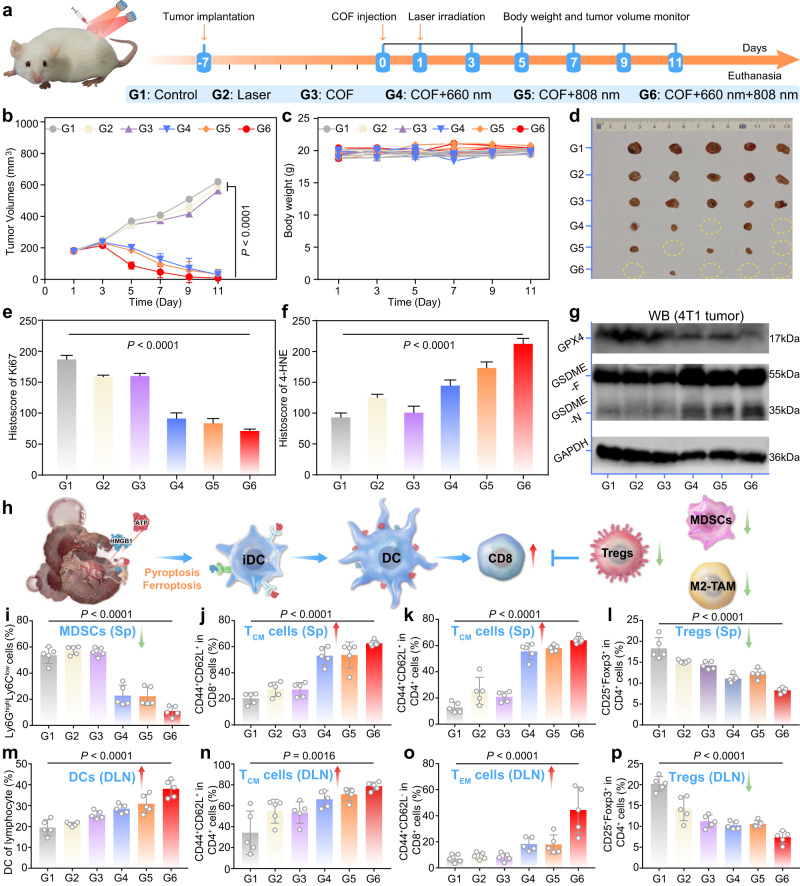
Fig. 7. Investigation of the in vivo therapeutic effect of COF-919-mediated phototherapy.
a Treatment schedule of COF-919-mediated phototherapy. Tumor volumes (b), body weights (c), and tumor images (d) of 4T1 tumor-bearing mice treated under different conditions; data are presented as mean ± SEM (n = 5 independent samples). Quantitative evaluation of Ki67(e) and 4-HNE (f); data are presented as mean ± SEM (n = 5 independent samples). g Western blot analysis was performed to determine the GPX4 and GSDME-N expression levels in tumor tissues; Western blot was done thrice independently with similar results. h Illustration of COF-919-mediated phototherapy to promote DC maturation. Quantitative evaluation of DCs in the DLN (m); TCM (j), and TEM (k) cells in the spleen; TCM (n) and TEM (o) cells in DLN; Tregs cells in the spleen (l) and DLN (p); MDSCs in the spleen (i); data are presented as mean ± SEM (n = 5 independent samples). Statistical significance was calculated via two-way ANOVA (b) and one-way ANOVA with Tukey’s multiple comparisons test (e, f, i–p). Source data are provided as a Source Data file.

