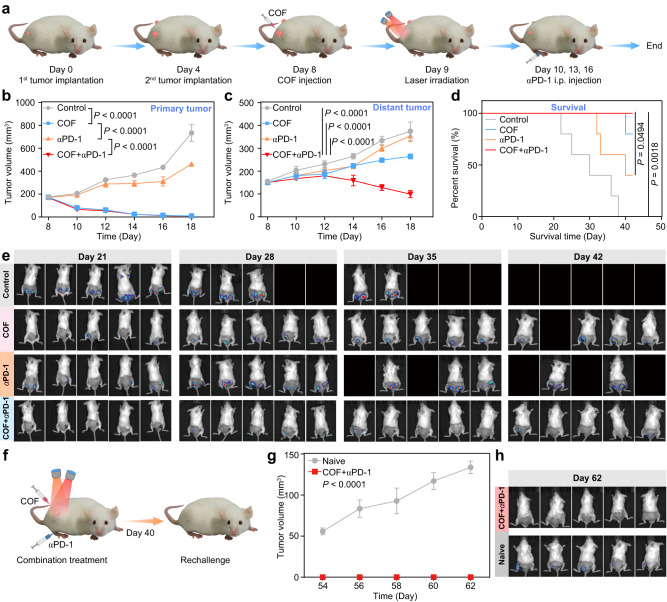
Fig. 8. The synergistic effect of COF-919 + αPD-1.
a Schedule of COF-919 + αPD-1 combination therapy. The growth curves of primary (b), distant tumor (c), and percent survival (d) of 4T1 tumor-bearing mice with different treatments; data are presented as mean ± SEM (n = 5 independent samples). e Bioluminescence images of 4T1 tumor-bearing mice at different times; data are presented as mean ± SEM (n = 5 independent samples). f Establishment of the rechallenge model. Tumor volume curves (g) and bioluminescence images (h) of naive and COF-919 + αPD-1 treatment groups at different times; data are presented as mean ± SEM (n = 5 independent samples). Statistical significance was calculated via two-way ANOVA with Tukey’s multiple comparisons test (b, c, g) and log-rank (Mantel–Cox) test (d). Source data are provided as a Source Data file.

