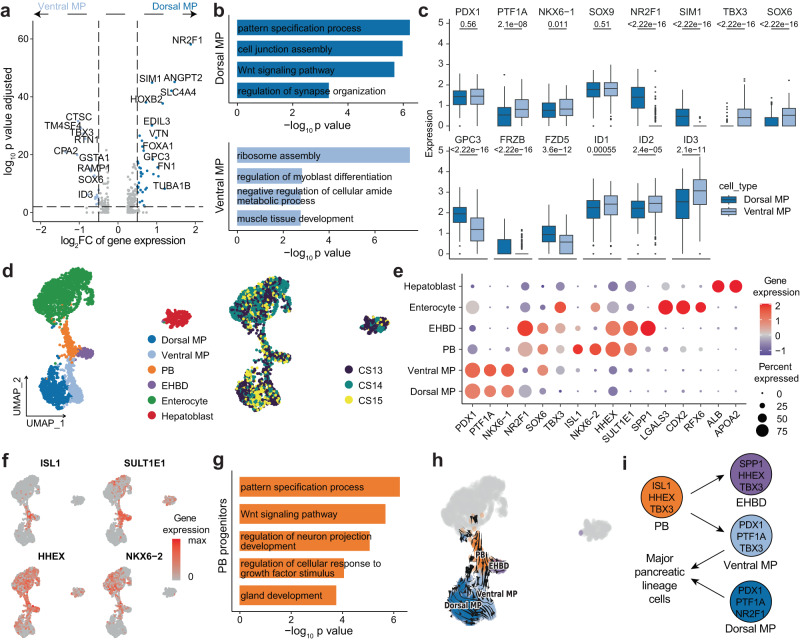
Fig. 2. Molecular diversity of epithelial cells in the early pancreas and peripancreatic organs.
a Volcano plot showing the differential gene expression between dorsal MP and ventral MP cells. Adjusted p-values were calculated by two-sided Wilcoxon test with Bonferroni correction. FC, fold change. b Bar plot showing the enriched GO terms of differentially expressed genes in dorsal MP and ventral MP cells. P-values were calculated by using enrichGO function from R package clusterProfiler with one-sided hypergeometric test. c Box plots showing key gene expression in dorsal MP and ventral MP cells. The numbers above the box plots represent the p-values calculated using the Wilcoxon test with two-sided comparisons. The center line, bounds of box, whiskers, and single points represent median, 25th to 75th percentile range, 5th and 95th percentile range as well as outliers. Dorsal MP cells, n = 607 cells; Ventral MP cells, n = 324 cells. d UMAP plot of all single cells colored by cell type and time point in early epithelial cells. CS Carnegie stages, EHBD extrahepatic bile ducts, PB pancreato-biliary progenitors. e Dot plot showing cell type marker gene expression in early epithelial cells. f Feature plot showing the expression of marker genes of PB progenitors. g Bar plot showing the enriched GO terms of differentially expressed genes in PB progenitors. P-values were calculated by using enrichGO function from R package clusterProfiler with one-sided hypergeometric test. h RNA velocity plot showing the developmental trajectory of PB, EHBD, ventral MP, and dorsal MP cells. i Model of PB progenitor differentiation. See also Supplementary Fig. 3 and Supplementary Data 3.

