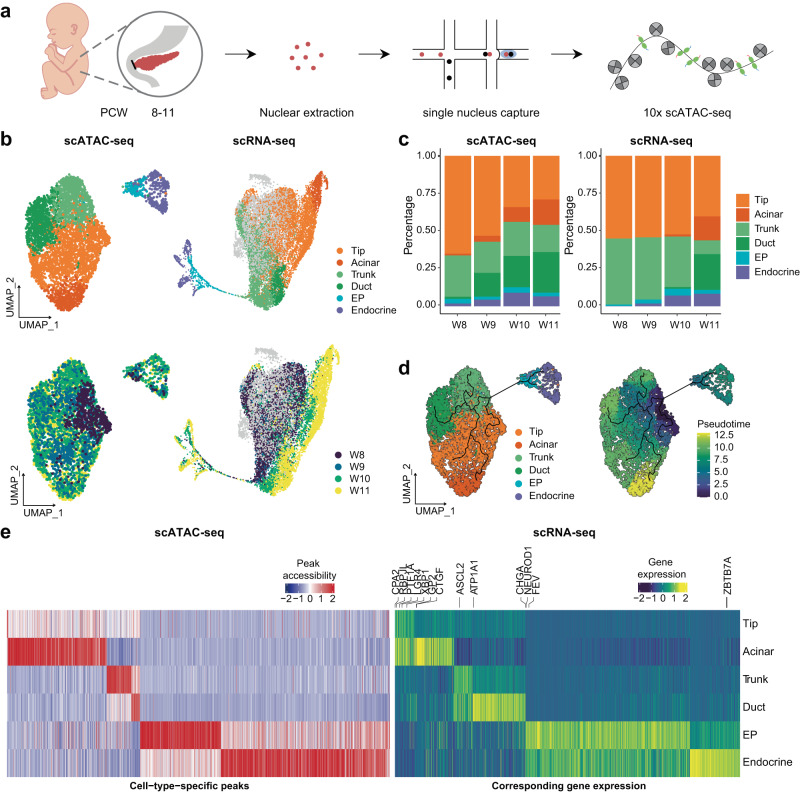
Fig. 3. Single-cell chromatin accessibility of pancreatic epithelial cells.
a Schematic diagram of the procedures for sample information, tissue processing, and scATAC-seq profiling methods. b UMAP plot of all single cells colored by cell type and time point in pancreatic epithelial cells. c Bar plot showing the percentage of each cell type in the scATAC-seq and scRNA-seq. d UMAP plot showing the development trajectory of epithelial cells in scATAC-seq. e Heatmap showing cell type specific peaks and their corresponding gene expression in scRNA-seq. See also Supplementary Fig. 4 and Supplementary Data 4.

