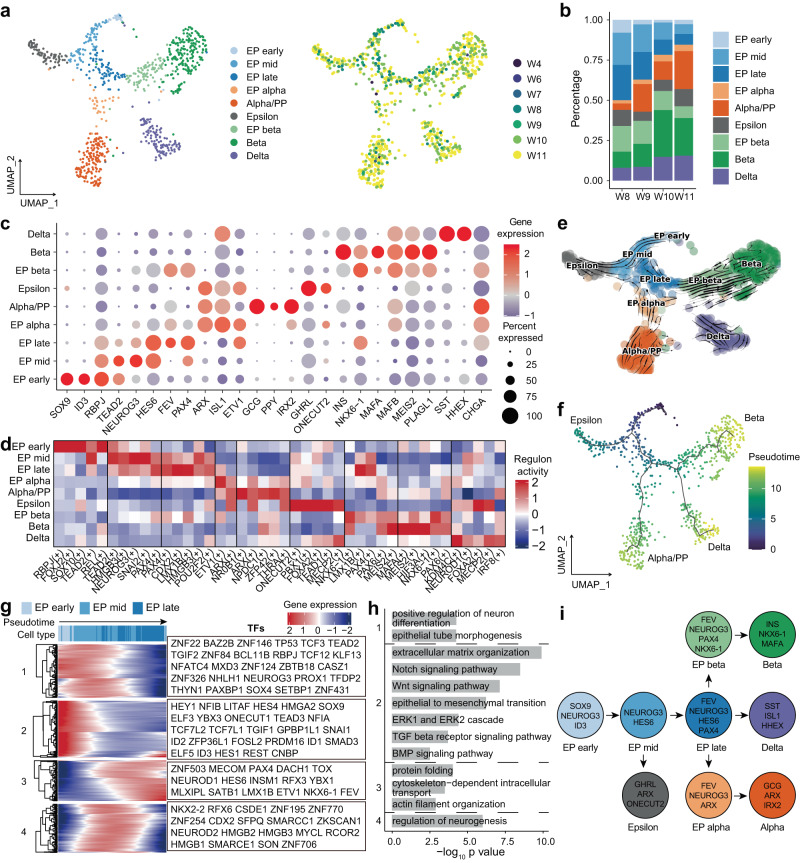
Fig. 6. Transcriptional heterogeneity of EPs and endocrine cells in the developing pancreas.
a UMAP plot of all single cells colored by cell type and time point in developing pancreatic endocrine cells. b Bar plot showing the percentage of each cell type in developing pancreatic endocrine cells. c Dot plot showing key marker gene expression in each cell type of developing pancreatic endocrine cells. d Heatmap showing the scaled activity of the top 5 highly scored regulons in each cell type of developing pancreatic endocrine cells. e RNA velocity plot showing the developmental trajectory of developing pancreatic endocrine cells. f UMAP plot showing the developmental trajectories of developing pancreatic endocrine cells. g Heatmap showing gene expression along the developmental trajectory of EP early to EP late cells. TFs are labeled on the right. h Selected enriched GO terms of genes in Fig. 6g. P-values were calculated by using enrichGO function from R package clusterProfiler with one-sided hypergeometric test. i Model of EP and endocrine cell differentiation. See also Supplementary Fig. 7 and Supplementary Data 5, 6.

