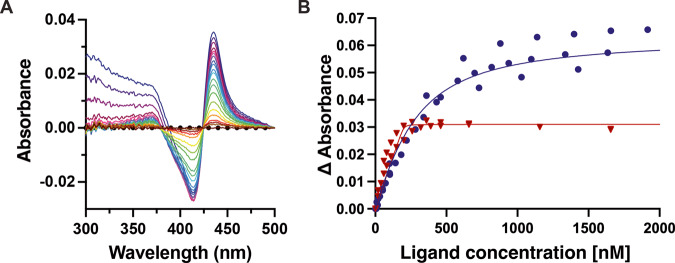
Fig. 4. Binding of 20-(R)-1 to human drug-metabolizing P450s.
A Optical difference spectrum showing titration of CYP3A4 with of 20-(R)-1 [0.01 (red) to 19.6 mM (violet)] also yields the difference spectrum peak at 435 nm indicative of Fe—CN bond formation. B A plot of the absorbance changes vs. ligand concentration reveals Kd values of approximately 163 nM for CYP3A4 (blue circles, n = 3, 95% CI 120–215 nM) and 0.49 nM for CYP2D6 (red triangles, n = 2, 95% CI undefined –6.4 nM), respectively. Protein concentration was 200 nM in a 5 cm cuvette. Data were fit to the tight-binding or quadratic equation.

