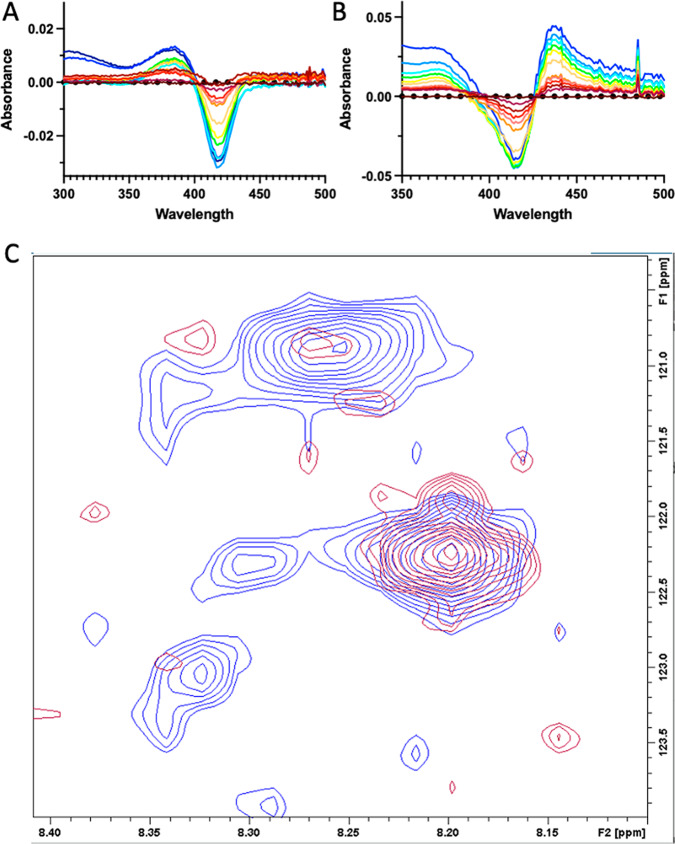
Fig. 5. CYP106A2 interaction with steroidal isonitriles.
A Absorbance difference spectra for titration of 1 µM CYP106A2 with 2 demonstrates blue shifted substrate-like “type I” binding (decrease at 422 nm and increase at 393 nm). Maximum concentration of 2 (light blue trace) is 20 µM. B Absorbance difference spectra for titration of 1 µM CYP106A2 with bis-isonitrile 4 demonstrates increasing absorbance at 435 nm consistent with formation of a heme Fe-isonitrile bond. Maximum concentration of 4 is ~10 µM (blue trace). C Overlay of 800 MHz 1H,15N-TROSY-HSQC spectra of 15N-Gly-labeled CYP106A2 with levopimaric acid p-benzoquinone Diels-Alder adduct bound after reduction with sodium dithionite and treatment with carbon monoxide (red), or with 7,17-(bis)isonitrile 4 (blue) after anaerobic reduction with sodium dithionite.

