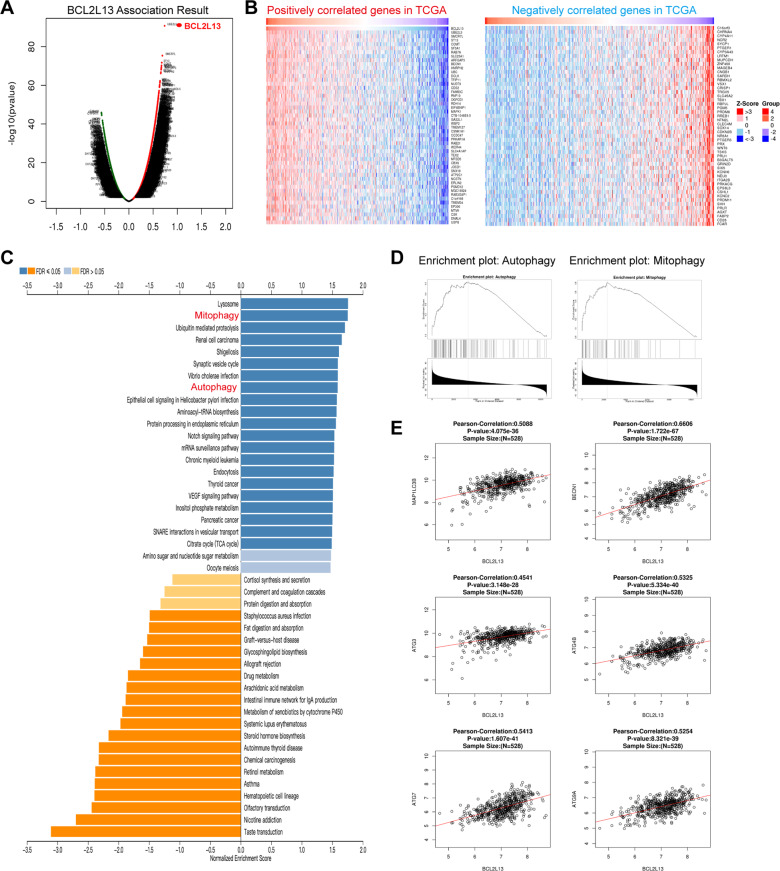
Fig. 3. Pathway analysis of BCL2L13 and co‐regulated genes in GBM.
A Volcano plot of genes correlated with BCL2L13 expression in the TCGA database. B Correlation analysis using TCGA data revealing positive and negatively correlated genes with BCL2L13 mRNA expression in human gliomas. C KEGG pathway analysis of the positive and negatively correlated genes of BCL2L13 in the TCGA database is illustrated. D GSEA highlighting positive association of increased BCL2L13 expression levels with autophagy and mitophagy. E Correlation between BCL2L13 and autophagy-related genes in gliomas determined using TCGA dataset.

