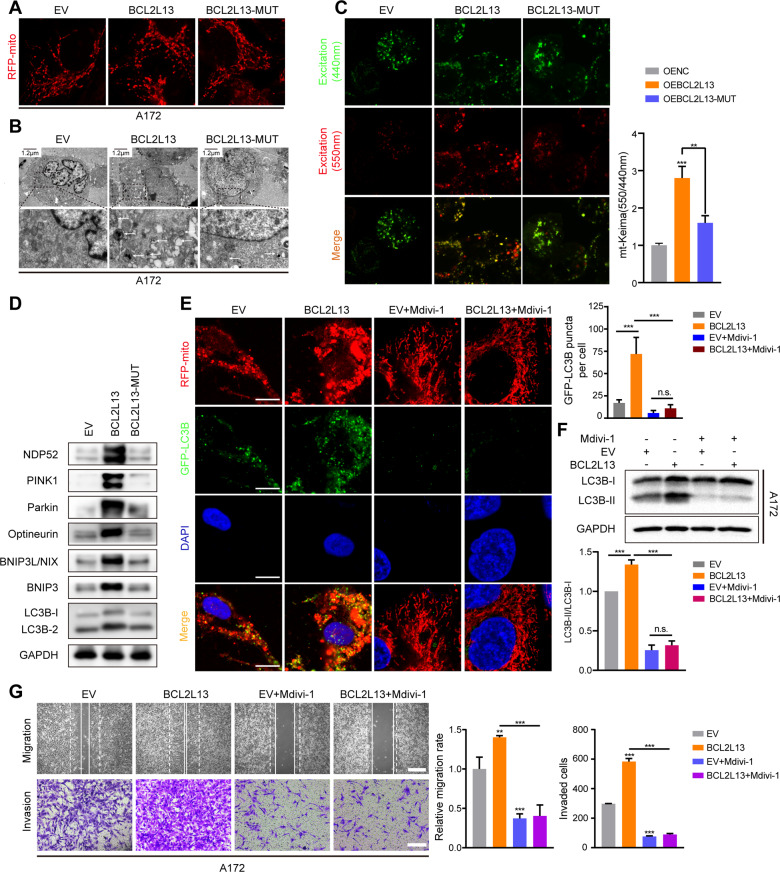
Fig. 7. BCL2L13 promotes mitochondrial fission-dependent mitophagy in GBM cells.
A Confocal microscopy analysis of mitochondrial morphology was visualized with MitoTracker Red in A172-EV/BCL2L13/BCL2L13-MUT cells. B TEM images of A172-EV/BCL2L13/BCL2L13-MUT cells. Arrows highlight autophagosomes (arrows). The scale bar in the original image represents 0.8 μm, and the scale bar in the enlarged image represents 0.3 μm. C Representative confocal images are of A172 cells expressing mt-Keima transfected with EV/BCL2L13/BCL2L13-MUT. D Western blotting analysis to detect protein levels of NDP52, PINK1, Parkin, Optineurin, BNIP3/NIX, BNIP3, LC3B and GAPDH (control for loading) in A172 cells transfected with EV/BCL2L13/BCL2L13-MUT. E Confocal microscopy images of GFP-LC3B and RFP-mito expressing A172-EV/BCL2L13 cells after Mdivi-1 (50 µM) treatment for 24 h (scale bars: 10 μm). F Western blotting analysis for LC3B in A172-EV/BCL2L13 cells after Mdivi-1 treatment. G Representative images and statistic results of migration and invasion ability of A172-EV/BCL2L13 cells treated with mdivi-1. All data are expressed as the mean ± SD of values from experiments performed in triplicate. ***P < 0.001 compared between the two treatments indicated.

