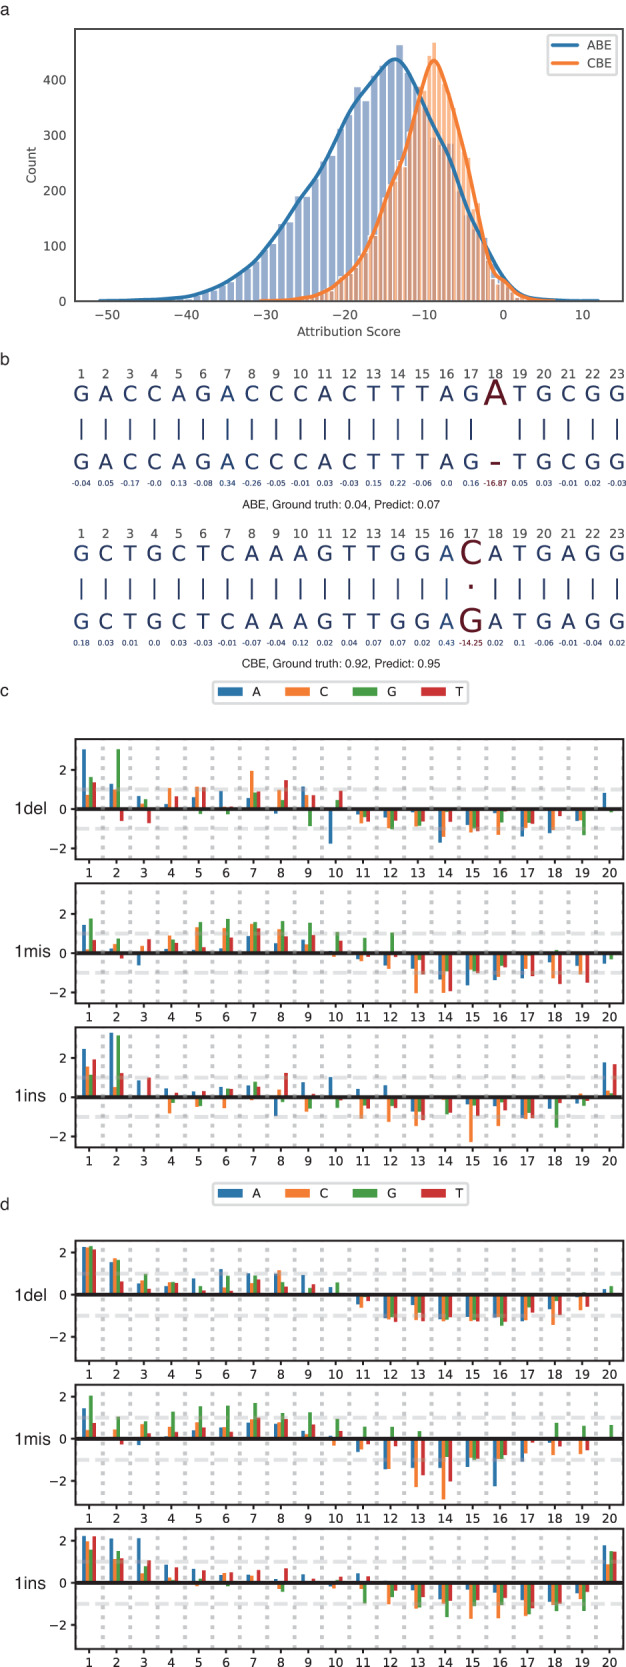
Fig. 4. Analysis of positional feature attributions associated with off:on-target ratio by LayerIntegratedGradient.

a Distribution of the attribution score for mutational nucleotides. b Two specific examples of feature attribution analysis. The mutational nucleotide alignment was marked in red. The numerical value below the nucleotide was the attribution score for that specific nucleotide position. The ground truth and predicted off:on-target ratio was also provided under the whole alignment sequence. c, d Positional feature attributions of off-target for 1 bp mismatch, 1 bp insertion, and 1 bp deletion on ABE and CBE, respectively. The attribution scores were standardized by the Z-score, where values higher than 1 or lower than −1 signified an important contribution. Source data are provided as a Source Data file.
