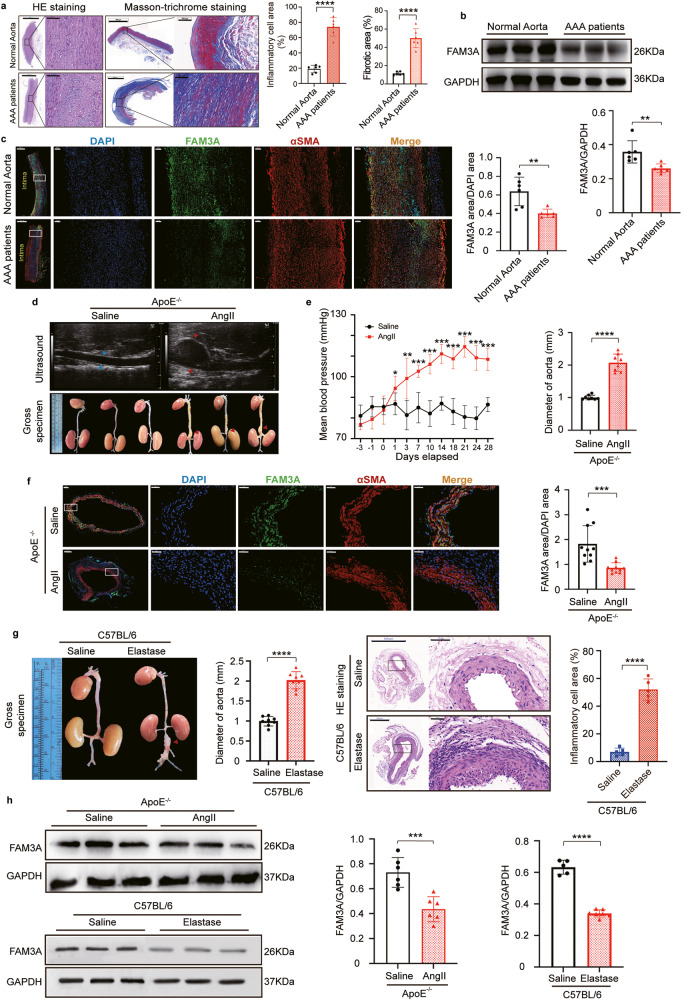
Fig. 1. The FAM3A protein level decreases in the arteries of AAA patients and murine models.
a Representative images of hematoxylin-eosin (HE) and Masson-trichrome staining of normal aortas and AAA of humans, and quantification of inflammatory cell infiltration and fibrosis in aorta tissues (n = 6 biologically independent samples). Scale bar: 2000 μm (HE staining) and 1000 μm (Masson-trichrome staining), insets: 200 μm (HE staining) and 100 μm (Masson-trichrome staining). b Western blot image and quantification to evaluate the expression of FAM3A in human aortic aneurysm compared to normal aorta (n = 6 biologically independent samples; quantitative comparisons between samples were run on the same gel). c Representative images and quantification of immunofluorescence staining identified FAM3A protein in human aortic aneurysm and normal aorta (n = 6 biologically independent samples). Scale bar: 1000 μm, insets: 100 μm. d Echocardiographic and gross specimen images of abdominal aortas from AngII-ApoE−/− murine AAA models and control mice (Representative images of n = 8 biologically independent animals). e Mean arterial pressure and arterial diameter were measured and quantified from AngII-ApoE−/− murine AAA models and control models (n = 8 biologically independent animals; *P < 0.05, **P ≤ 0.001, ***P ≤ 0.0001 versus Saline group in the term of Mean arterial pressure). f Representative images and quantification of immunofluorescence staining of FAM3A in aortas from AngII-ApoE−/− murine AAA models and control models (n = 10 biologically independent animals). Scale bar: 100 μm (Saline) and 200 μm (AngII), insets: 50 μm. g Gross specimen image and quantification of aortic diameter in Elastase-C57BL/6 murine AAA models and control models (left panel, n = 8 biologically independent animals); HE staining of abdominal aorta from Elastase-C57BL/6 murine AAA models and control models and quantification of inflammatory cell infiltration in aortic tissues (right panel, n = 5 biologically independent animals). Scale bar: 500 μm, insets: 50 μm. h Representative western blot images and quantification of the FAM3A expression levels in aortas from AngII-ApoE−/− and Elastase-C57BL/6 murine AAA models and their control models (n = 6 biologically independent animals in AngII-ApoE−/− modeling; n = 5 or 7 biologically independent animals in Saline or Elastase group, respectively in C57BL/6 modeling; quantitative comparisons between samples were run on the same gel). Data are presented as mean ± SEM (a–c, e–h). Statistical significance was calculated with two-tailed independent t test (a–c, e–h) and P values are indicated (nsP ≥ 0.05, *P < 0.05, **P ≤ 0.01, ***P ≤ 0.001, ****P ≤ 0.0001). Source data are provided as a Source Data file.

