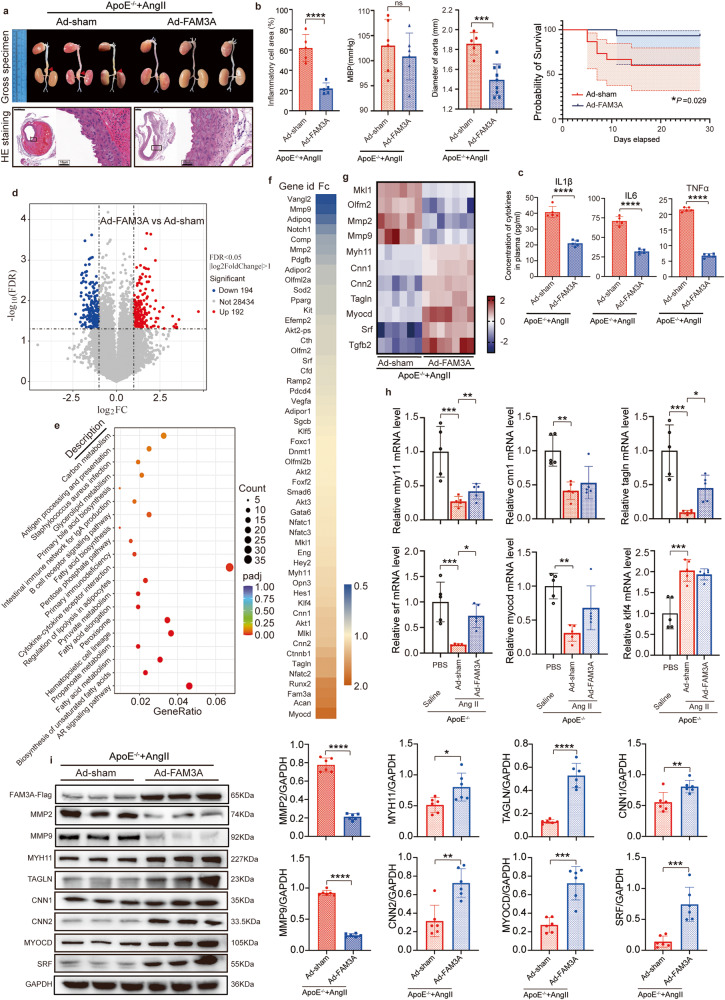
Fig. 2. Overexpression of FAM3A in the AngII-ApoE−/− murine AAA model attenuates pathological outcomes.
a Gross specimen image and HE staining of aortas from AngII-ApoE−/− murine AAA models treated with or without FAM3A overexpression by adenovirus (Representative images of n = 5 or 8 biologically independent animals in Ad-sham or Ad-FAM3A, respectively). Scale bar: 500 μm (Ad-sham) and 200 μm (Ad-FAM3A), insets: 10 μm. b Inflammatory cell infiltration in the aorta (n = 5 biologically independent animals), mean arterial pressure (n = 6 biologically independent animals), arterial diameter (n = 9 or 14 biologically independent animals in Ad-sham or Ad-FAM3A, respectively), and survival probability (n = 15 biologically independent animals) were measured and quantified from mice treated as in (a). c ELISAs were used to evaluate the plasma inflammatory factors from mice treated as in (a) (n = 5 biologically independent animals). d Volcano plot showing differentiated expressed genes determined by RNA sequencing in aortas from mice treated as in (a). e Functional enrichment analysis of KEGG is shown. f, g The differentially expressed VSMC-phenotype-switching-related genes (f) and the VSMC contractile marker genes (g) are shown in the heatmap. h The overexpressed crucial marker gene expression levels were evaluated by qRT-PCR (n = 5 biologically independent animals). i Representative western blot images and quantification of VSMC contractile marker proteins are shown in aortas from mice treated as in (a) (n = 6 biologically independent animals; quantitative comparisons between samples were run on the same gel). Data are presented as mean ± SEM (b, c, h, i) and mean ± 95% CI (Probability of survival in (b)). Statistical significance was calculated with two-tailed independent t test (Inflammatory cell infiltration, MBP, Diamer of aorta in (b), (c), (i)), Kaplan–Meier analysis and log-rank test (Probability of survival in (b)) and one-way ANOVA followed by Tukey post hoc test (h) and P values are indicated (nsP ≥ 0.05, *P < 0.05, **P ≤ 0.01, ***P ≤ 0.001, ****P ≤ 0.0001). Source data are provided as a Source Data file.

