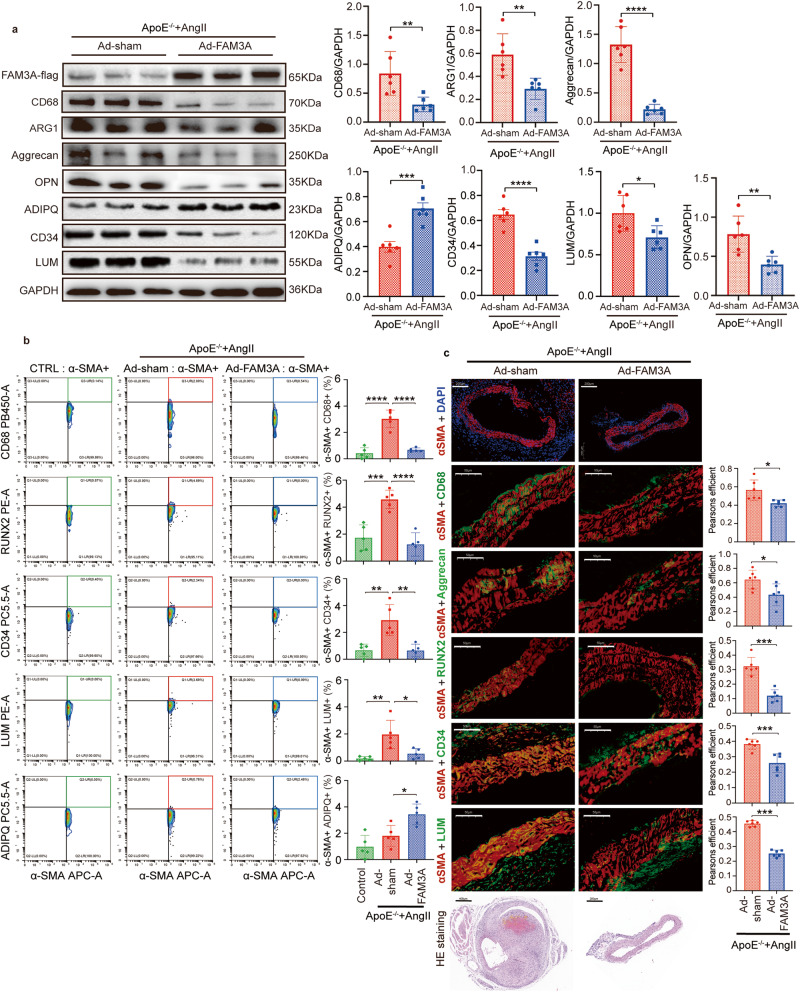
Fig. 4. FAM3A influences VSMC transdifferentiation toward other intermediate cell types.
a Representative western blot images and quantification of markers of macrophages (CD68 and ARG1), chondrocytes (Aggrecan), and osteogenic cells (OPN) are shown in aortas from AngII-ApoE−/− murine AAA models treated with or without FAM3A overexpression by adenovirus (n = 6 biologically independent animals; quantitative comparisons between samples were run on the same gel). b Flow cytometry plot analysis of transdifferentiated cells in VSMCs in aortas from ApoE−/− control mice and AngII-ApoE−/− murine AAA models treated with or without FAM3A overexpression by adenovirus. Graphs show the percentage of VSMCs transdifferentiated toward the intermediate cell types of macrophages (αSMA+CD68+), osteogenic cells (αSMA+RUNX2+), mesenchymal cells (αSMA+CD34+), fibroblasts (αSMA+LUM+), and adipocytes (αSMA+ADPIQ+) (n = 5 biologically independent samples). c Representative images and quantification of immunofluorescent costaining of markers between VSMCs (αSMA) and macrophages (CD68), chondrocytes (Aggrecan), osteogenic cells (RUNX2), mesenchymal cells (CD34), or fibroblasts (LUM) respectively in aortas from mice treated as in (a) (red indicates αSMA, green indicates CD68, Aggrecan, RUNX2, CD34, or LUM respectively, and orange indicates αSMA+CD68+, αSMA+Aggrecan+, αSMA+RUNX2+, αSMA+CD34+, or αSMA+LUM+, respectively; n = 6 biologically independent animals). Scale bar (images of immunofluorescence): 200 μm (αSMA + DAPI) and 50 μm (for others), scale bar (HE staining): 400 μm (Ad-sham) and 200 μm (Ad-FAM3A). Data are presented as mean ± SEM (a–c). Statistical significance was calculated with two-tailed independent t test (a, c) and one-way ANOVA followed by Tukey post hoc test (b) and P values are indicated (*P < 0.05, **P ≤ 0.01, ***P ≤ 0.001, ****P ≤ 0.0001). Source data are provided as a Source Data file.

