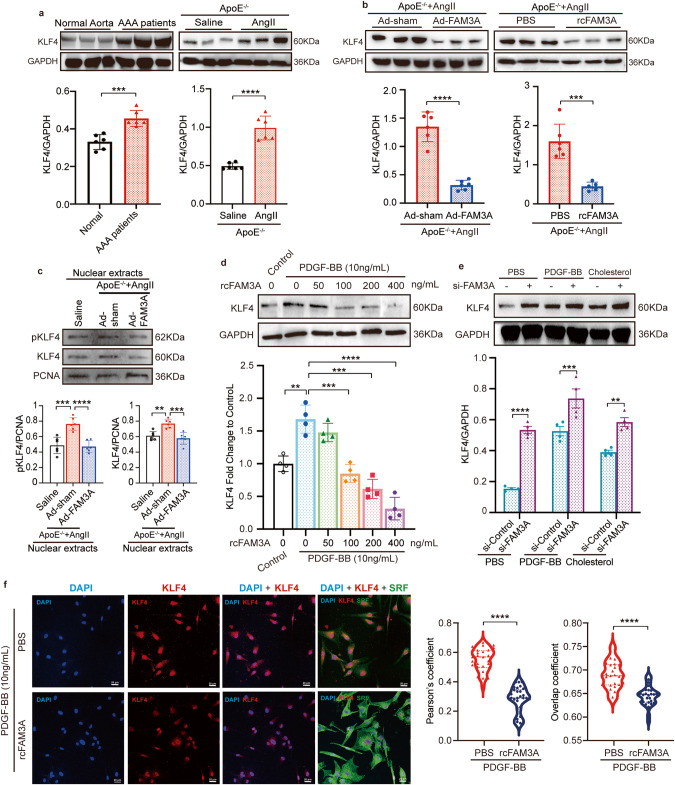
Fig. 5. FAM3A suppresses KLF4 production and nuclear localization.
a Representative western blot images and quantification of KLF4 in aortas from AAA patients and murine AAA models (n = 6 biologically independent samples or animals). b Representative western blot images and quantification of KLF4 in aortas from AngII-ApoE−/− murine AAA models treated with or without FAM3A overexpression by adenovirus (left, n = 6 biologically independent animals) and treated with or without recombinant FAM3A supplementation (right, n = 6 or 5 biologically independent animals in PBS or rcFAM3A group, respectively). c Representative western blot images and quantification of KLF4 signaling in aortic nuclear extracts from saline-ApoE−/− mice and AngII-ApoE−/− murine AAA models treated with or without FAM3A overexpression by adenovirus (n = 6 biologically independent animals). d, e VSMCs were cultured and treated with PDGF, cholesterol, recombinant FAM3A (d), or FAM3A siRNA (e) as indicated in the charts. Representative western blot images and quantification of KLF4 in whole cell lysates are shown (n = 4 biologically independent experiments). Quantitative comparisons between samples were run on the same gel (a–e). f Confocal imaging showed the cellular localization of nuclei (blue), KLF4 (red), and SRF (green). The colocalization of nucleus and KLF4 was analyzed by ImageJ software with Pearson’s correlation coefficient (PCC, left) and Manders’ colocalization coefficients (MCC, right) quantifications (n = 4 biologically independent experiments with 24 scans for each group). Scale bar: 20 μm. Data are presented as mean ± SEM (a–e) and median ± IQR (f). Statistical significance was calculated with two-tailed independent t test (a, b, e), one-way ANOVA followed by Tukey post hoc test (c, d), and ManneWhitney U test (f) and P values are indicated (*P < 0.05, **P ≤ 0.01, ***P ≤ 0.001, ****P ≤ 0.0001). Source data are provided as a Source Data file.

