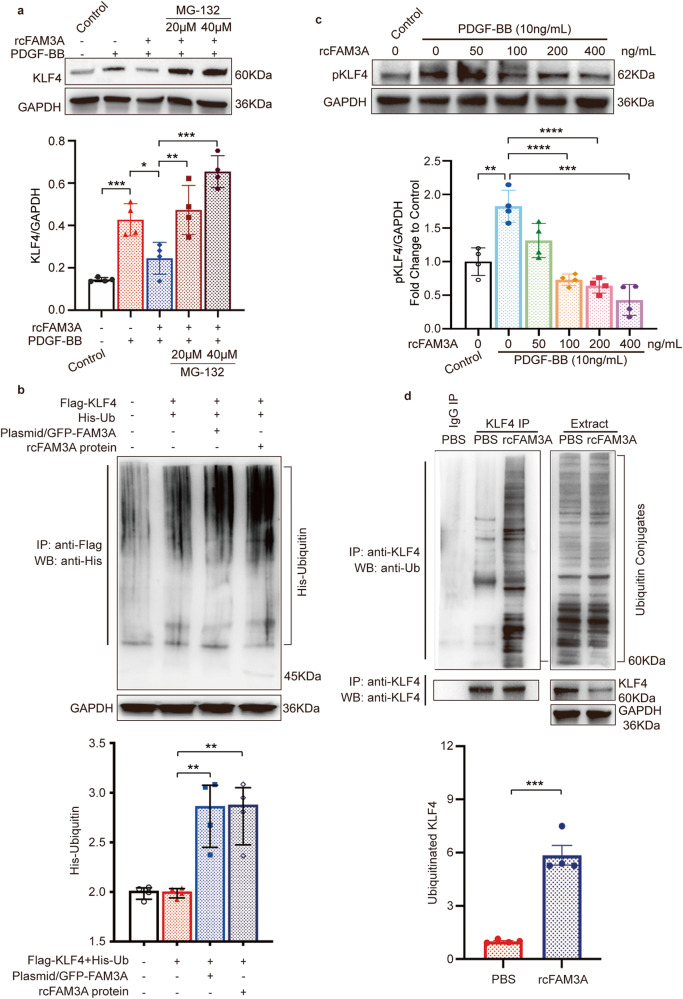
Fig. 6. FAM3A influences KLF4 post-translational modification.
a VSMCs were treated with PDGF and recombinant FAM3A in the presence or absence of MG-132. Representative western blot images and quantification of KLF4 in whole cell lysates are shown (n = 4 biologically independent experiments). b The HEK293T cells were cotransfected with Flag-KLF4 and His-Ub, and then transfected with the FAM3A overexpression plasmid or treated with recombinant FAM3A protein. Whole cell lysates were prepared, and KLF4 protein was precipitated with anti-KLF4. The presence of ubiquitin-conjugated KLF4 in the immunocomplex was detected by western blot with anti-His (upper). GAPDH was detected in the same whole cell lysates (lower). Representative western blot images and quantification of KLF4 ubiquitination levels normalized to GAPHD are shown (n = 4 biologically independent experiments). c VSMCs were treated with recombinant FAM3A at the indicated concentration gradient. Representative western blot images and quantification of phosphorylated KLF4 (Ser254) in whole cell lysates are shown (n = 4 biologically independent experiments). d VSMCs were treated with recombinant FAM3A. Whole cell lysates were prepared and KLF4 protein was precipitated with anti-KLF4. The presence of ubiquitin-conjugated KLF4 in the immunocomplex was detected by western blots with anti-Ub (left, upper). The amount of precipitated KLF4 in the immunocomplex was determined by anti-KLF4 (left, lower). The endogenous ubiquitin conjugates (right, upper), KLF4 (right, middle), and GAPDH (right, lower) were detected in the same whole cell lysates (Extract). Representative western blot images and quantification of KLF4 ubiquitination levels normalized to GAPHD are shown (n = 4 biologically independent experiments). Quantitative comparisons between samples were run on the same gel (a–d). Data are presented as mean ± SEM (a–d). Statistical significance was calculated with one-way ANOVA followed by Tukey post hoc test (a–c) and two-tailed independent t test (d) and P values are indicated (*P < 0.05, **P ≤ 0.01, ***P ≤ 0.001, ****P ≤ 0.0001). Source data are provided as a Source Data file.

