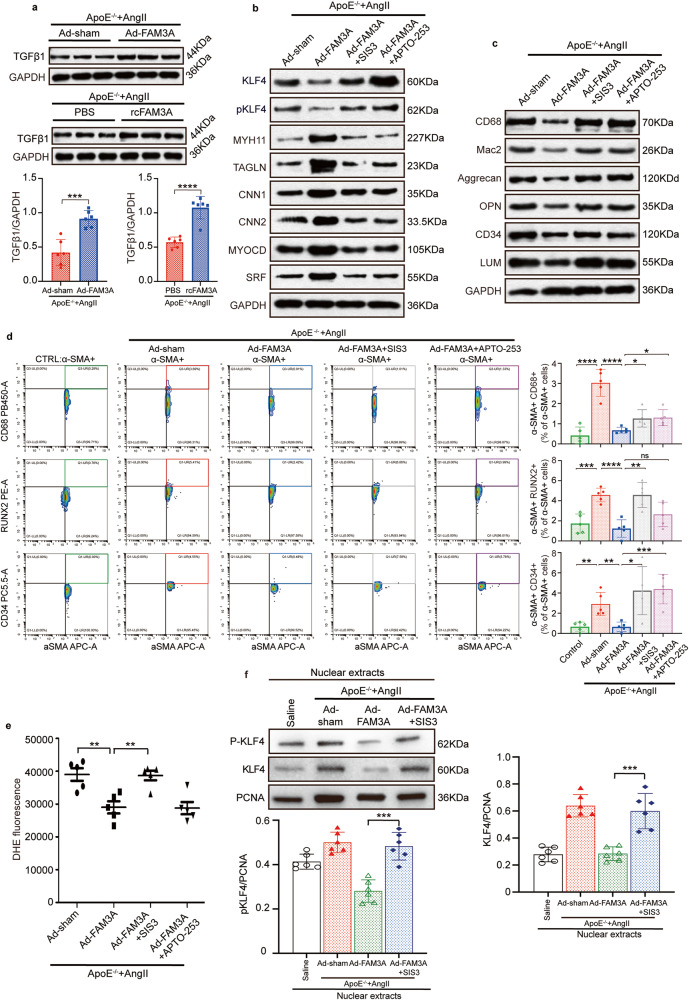
Fig. 8. TGFβ and KLF4 signaling is involved in the regulatory effect of FAM3A on VSMC differentiation reprogramming in vivo.
a Representative western blot images and quantification of TGFβ1 in aortas from AngII-ApoE−/− murine AAA models treated with or without FAM3A overexpression by adenovirus and treated with or without recombinant FAM3A supplementation (n = 6 biologically independent animals). b Representative western blot images of TGFβ1, KLF4 signaling, and VSMC contractile markers in aortas from AngII-ApoE−/− murine AAA models treated with or without FAM3A overexpression by adenovirus in the presence of SIS3 or APTO-253 (n = 5 biologically independent animals). c Representative western blot images of VSMC transdifferentiation markers in aortas from mice treated as in (b) (n = 5 biologically independent animals). d Flow cytometry plot analysis of transdifferentiated VSMCs in aortas from ApoE−/− control mice and AngII-ApoE−/− murine AAA models treated with or without FAM3A overexpression by adenovirus in the presence of SIS3 or APTO-253. Graphs show the percentage of VSMCs transdifferentiated toward the intermediate cell types of macrophages (αSMA+CD68+), osteogenic cells (αSMA+RUNX2+) and mesenchymal cells (αSMA+CD34+) (n = 5 biologically independent samples). e Quantification of ROS with the DHE method in aortas from mice treated as in (b) (n = 5 biologically independent animals). f Representative western blot images and quantification of KLF4 signaling in aortic nuclear extracts from saline-ApoE−/− mice and AngII-ApoE−/− murine AAA models treated with or without FAM3A overexpression by adenovirus in the presence of SIS3 (n = 6 biologically independent animals). Quantitative comparisons between samples were run on the same gel (a–c, f). Data are presented as mean ± SEM (a, d, e, f). Statistical significance was calculated with two-tailed independent t test (a) and one-way ANOVA followed by Tukey post hoc test (d–f) and P values are indicated (*P < 0.05, **P ≤ 0.01, ***P ≤ 0. 001, ****P ≤ 0.0001). Source data are provided as a Source Data file.

