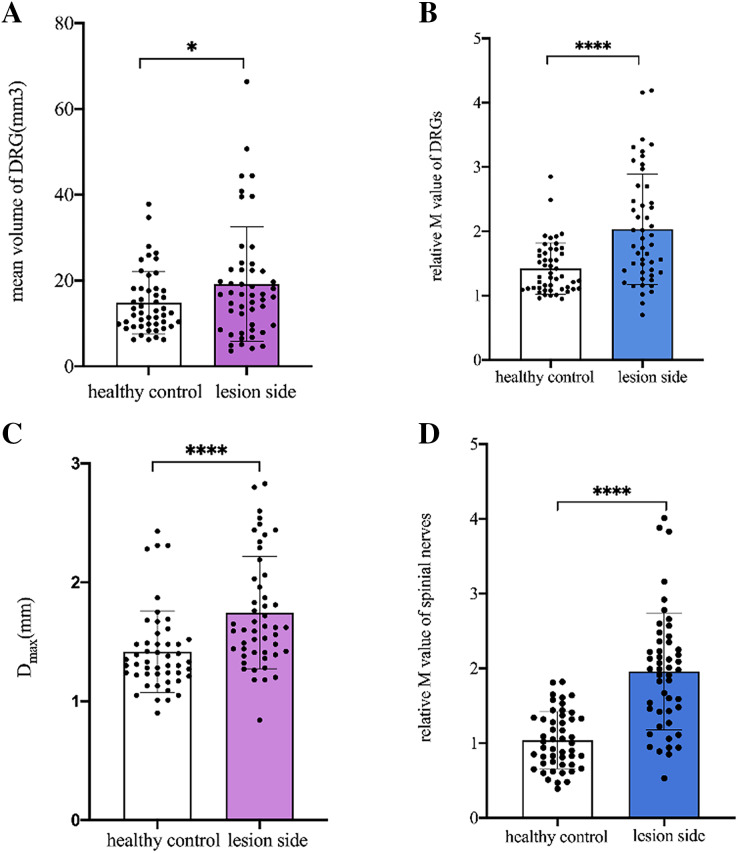
Figure 3. Comparison of DRGs and spinal nerves between lesioned side of patients and healthy controls.
(A) The mean VDRG of DRGs in the lesioned side of patients were significantly more than that in the same side of healthy controls (19.2 ± 13.3 vs 14.85 ± 7.308, *p = 0.013). (B) The relative M value of DRGs in the lesioned side of patients were significantly more than that in the same side of healthy controls (2.03 ± 0.86 vs 1.42 ± 0.40, ****p < 0.001). (C) The mean Dmax of spinal nerves in the lesioned side of patients was significantly more than that in the same side of healthy controls (1.746 ± 0.47 vs 1.418 ± 0.34, ****p < 0.001). (D) The relative M value of spinal nerves in the lesioned side of patients was significantly more than that in the same side of healthy controls (1.96 ± 0.78 vs 1.04 ± 0.38, ****p < 0.001). Paired-samples t-tests was used to compare the data between two groups.

