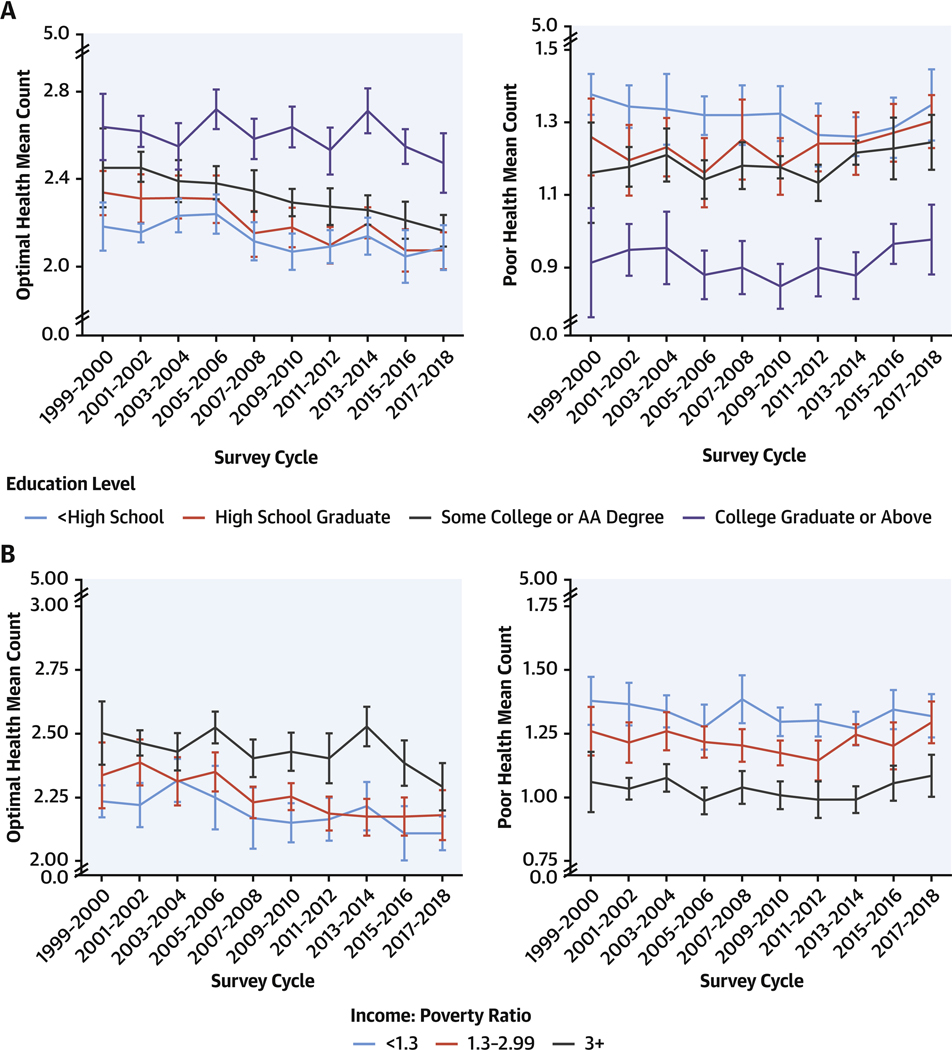
FIGURE 2. Mean Counts of Cardiometabolic Components by Education and Income, 1999 to 2018.
Survey-weighted national mean (line) and 95% CIs (error bars) for U.S. adults are shown for counts of optimal and poor levels for 5 cardiometabolic components: adiposity, blood glucose, blood lipids, blood pressure, and prior CVD (see Table 1 for definitions) by (A) education level and (B) income: poverty ratio. Mean counts were adjusted for NHANES survey weights and age-standardized to the 2017–2018 survey cycle age proportions. The findings show U.S. adults with lower educational attainment were more likely to have lower counts of optimal levels and higher counts of poor levels, with declining disparities by education level between 1999 and 2018. Abbreviations as in Figure 1.

