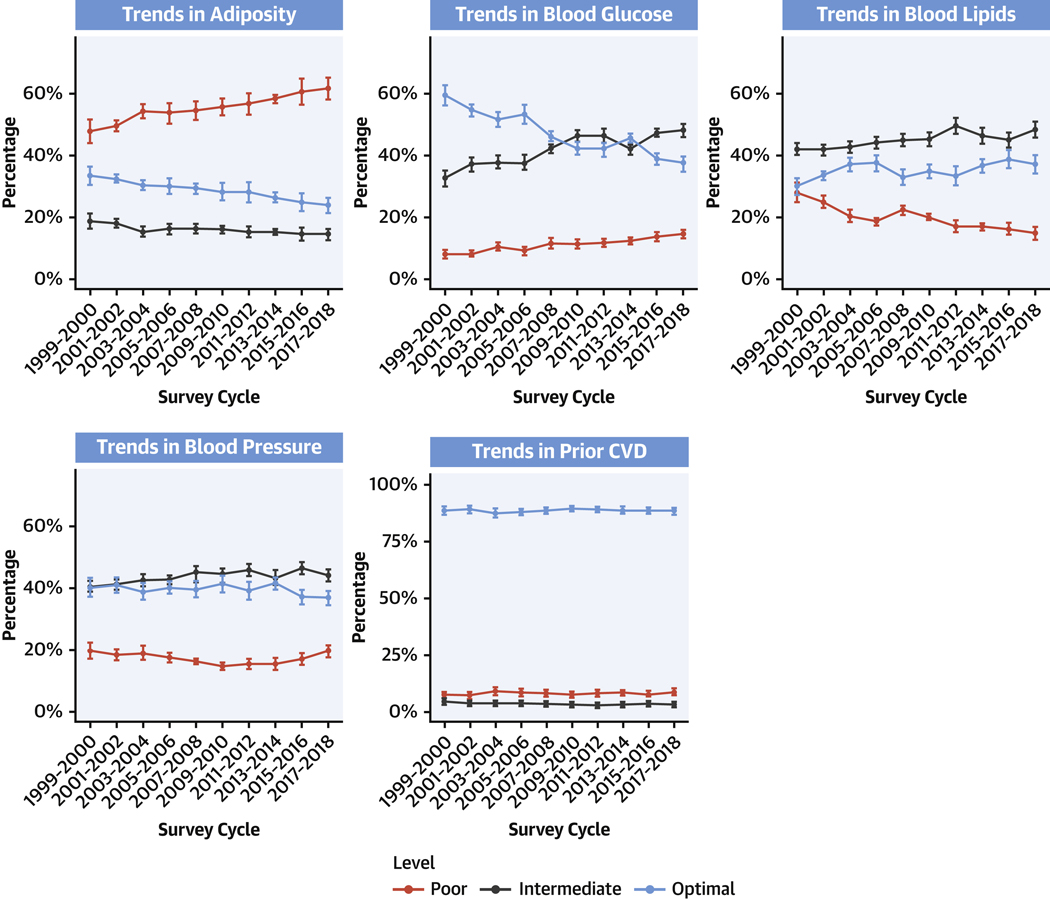
FIGURE 3. Trends in 5 Major Cardiometabolic Components Among U.S. Adults, 1999 to 2018.
Survey-weighted national proportions (lines) and 95% CIs (error bars) are shown for optimal, intermediate, and poor levels for each cardiometabolic component: adiposity, blood glucose, blood lipids, blood pressure, and prior CVD (see Table 1 for definitions). Prevalence estimates were adjusted for NHANES survey weights to represent the national U.S. population of noninstitutionalized adults. The findings show worsening levels (eg, higher prevalence of poor levels along with lower prevalence of optimal levels) of adiposity and glucose, and to a lesser extent blood pressure, among U.S. adults from 1999 to 2018. Prevalence of CVD remained fairly stable, whereas optimal and intermediate levels of blood lipids improved. Abbreviations as in Figure 1.

