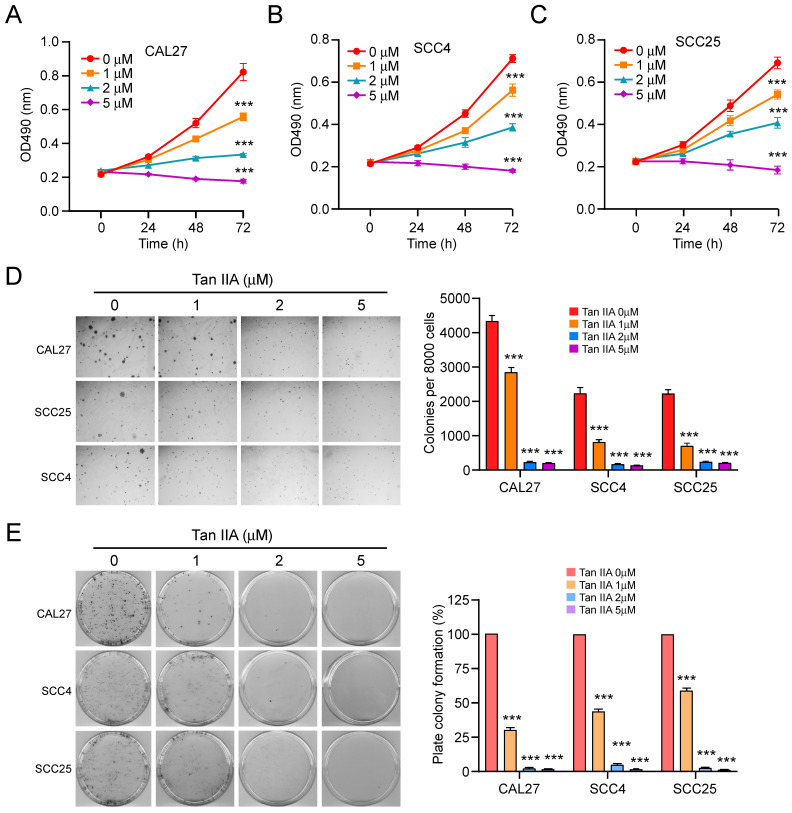
Figure 1.
Tan IIA suppressed cell viability and colony formation. (A-C) CAL27 (A), SCC4 (B), and SCC25 (C) cells were treated with different concentrations of Tan IIA (0-5 μM) for indicated times. Cell viability was measured by MTS assay. (D) Colony formation of CAL27, SCC4, and SCC25 cells exposed to different concentrations of Tan IIA (0-5 μM). (e) CAL27, SCC4, and SCC25 cells were treated with Tan IIA (0-5 μM) for 24h, then plated into the 6-well plate, and the plate colony formation was examined. ***, p < 0.001.

