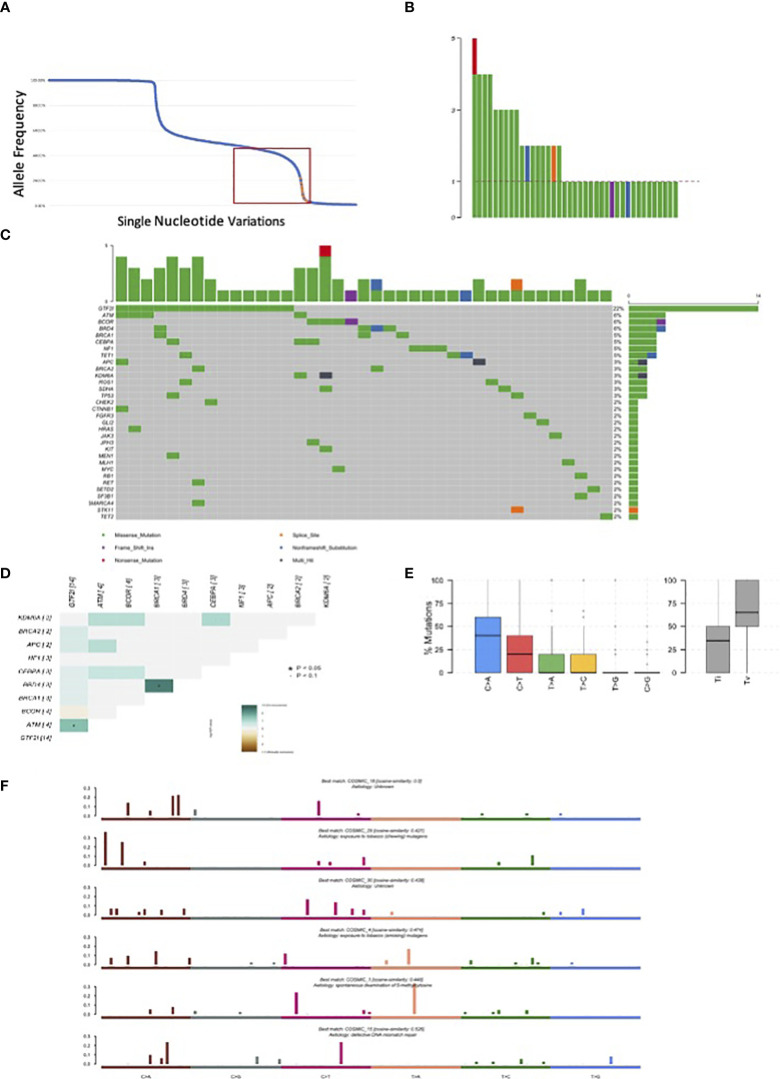
Figure 2.
Mutations observed in our series of 67 resected thymomas associated to myasthenia gravis. (A) Orange dots represent GTF2I mutations; blue dots all other variations. The curve has a bimodal distribution with a relevant number of variations with an allele fraction of 100% or 50% corresponding to homozygous and heterozygous polymorphisms. (B) Number of candidate somatic mutations affecting the coding sequence observed for each tumor. (C) Most frequently mutated genes in thymomas and type of mutations observed according to color legend. (D) Concordance table of co-occurring and mutually exclusive mutations. Significant co-occurrence are highlighted with * if p<0.05 and with * if border line significant with p<0.1. (E) Boxplot representation of mutations observed in the coding sequence of thymomas. (F) Mutational signatures enriched in thymomas.

