
FIGURE 1.
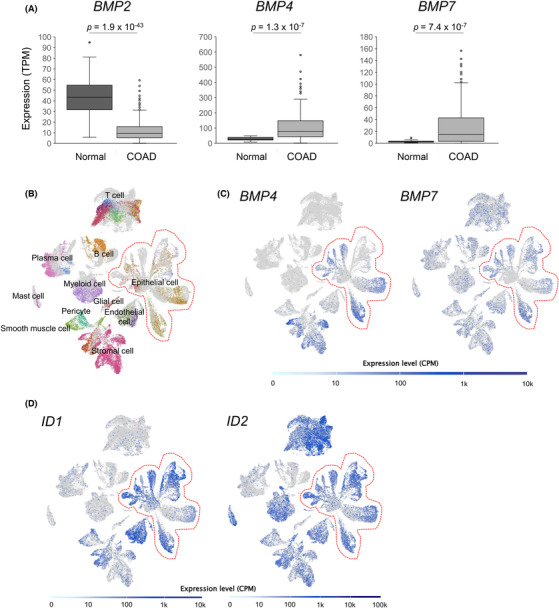
Bone morphogenetic protein (BMP) pathway is active in clinical colorectal cancer (CRC) tumors. (A) Box and whisker plots of BMP2, BMP4, and BMP7 expression (transcripts per million [TPM]) in normal colon (normal n = 41) and colorectal adenocarcinoma (COAD n = 308) tissue specimen. p values calculated by Student's t‐test are indicated. (B–D) Uniform Manifold Approximation and Projection (UMAP) for the single‐cell RNA‐sequencing data of nine CRC patients' specimens. Cell types corresponding to each cluster are designated on the UMAP (B). More detailed cluster labeling is presented in Figures S1‐S9.. (C) BMP4 and BMP7, as well as (D) ID1 and ID2 expression levels, are plotted on the UMAP. Areas enclosed by red dotted lines indicate clusters of epithelial cells. CPM, counts per million.