
FIGURE 1.
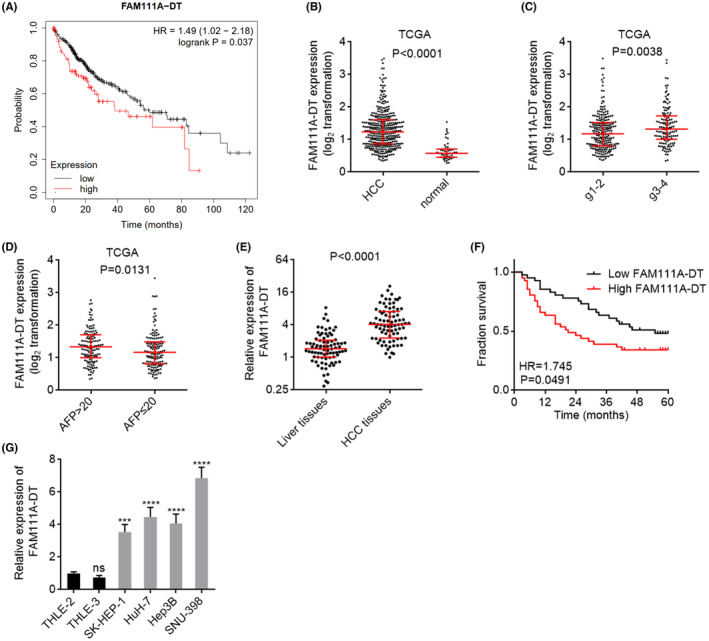
FAM111A‐DT was highly expressed and correlated with poor survival in hepatocellular carcinoma (HCC). (A) The correlation between FAM111A‐DT expression and overall survival according to the TCGA liver hepatocellular carcinoma (LIHC) data, analyzed by the online tool Kaplan–Meier Plotter. p = 0.037, HR = 1.49 by log‐rank test. (B) The expression of FAM111A‐DT in 371 HCC tissues and 50 normal liver tissues according to the TCGA‐LIHC data. Results are shown as median with interquartile range. p < 0.0001 by Mann–Whitney test. (C) The expression of FAM111A‐DT in 232 HCC tissues with grade 1 and 2, and 134 HCC tissues with grade 3 and 4, according to the TCGA‐LIHC data. Results are shown as median with interquartile range. p < 0.0001 by Mann–Whitney test. (D) The expression of FAM111A‐DT in 131 HCC tissues with AFP > 20, and 147 HCC tissues with AFP ≤ 20, according to the TCGA‐LIHC data. Results are shown as median with interquartile range. p < 0.0001 by Mann–Whitney test. (E) The expression of FAM111A‐DT in 82 pairs of HCC tissues and adjacent noncancerous liver tissues was measured by qPCR. Results are shown as median with interquartile range. p < 0.0001 by Wilcoxon matched‐pairs signed‐rank test. (F) Kaplan–Meier survival analysis of the correlation between FAM111A‐DT expression and overall survival in our HCC cohort containing 82 cases. p = 0.0491, hazard ratio (HR) = 1.745 by log‐rank test. (G) The expression of FAM111A‐DT in immortalized liver cell lines THLE‐2 and THLE‐3, and HCC cell lines SK‐HEP‐1, HuH‐7, Hep3B, and SNU‐398 was measured by qPCR. Results are shown as mean ± standard deviation (SD) of n = 3 independent experiments. ***p < 0.001, ****p < 0.0001, ns, not significant, by one‐way ANOVA followed by Dunnett's multiple comparisons test.