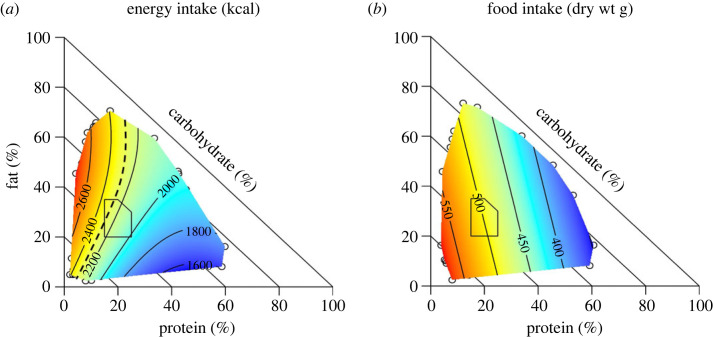
Figure 3.
Right-angled mixture triangle showing relationships between variation in the three-dimensional macronutrient composition of daily diets of 9341 free-living adult Australians and energy intake (a) and food intake (b). In these plots, dietary per cent carbohydrate increases from the diagonal that connects 100% fat with 100% protein (which represents 0% carbohydrate) to the origin (100% carbohydrate) [92]. The dashed line in (a) represents the estimated average energy requirement of respondents, delineating diets predicted to be associated with positive (left) and negative (right) energy balance. The superimposed polygon shows the acceptable macronutrient distribution range recommended in the diets of Australians (from [13]).

