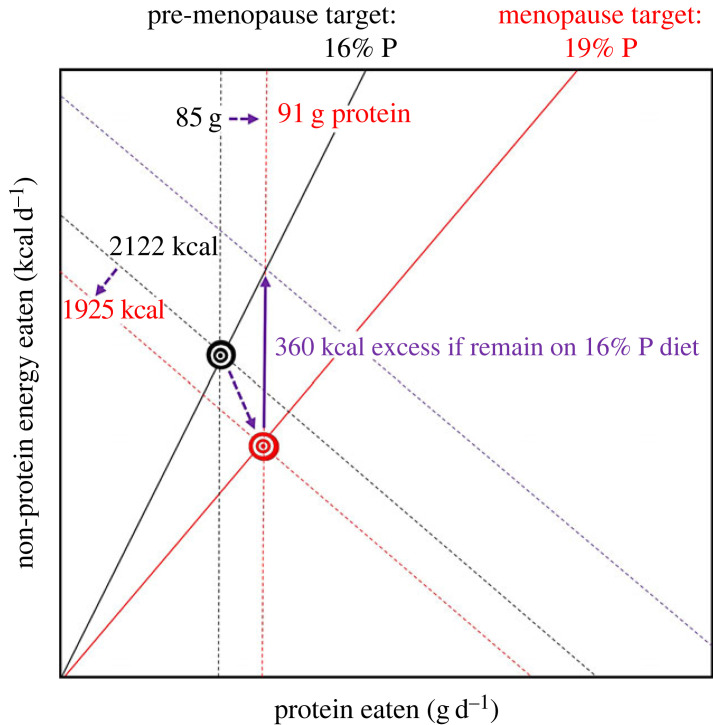
Figure 6.
Graphical model illustrating the implications of the shift in protein and energy requirements during the menopause transition, parameterized using data from the literature. The black bullseye illustrates daily target intakes for protein and non-protein energy prior to menopause. The red bullseye indicates an increased need for protein during the menopausal transition (7%) accompanied by reduced energy requirements (9%) owing to a reduction in physical activity. Simultaneously meeting the higher-protein target while remaining in energy balance requires shifting to a higher per cent protein diet (red radial), whereas reaching the protein intake target while remaining on a 16% protein diet requires ingesting excess calories (purple arrow) (from [101]).

