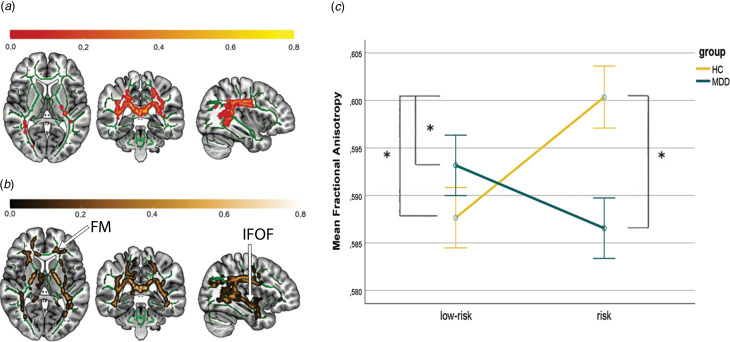
Figure 2.
Interaction effect of diagnosis and familial risk, and effect of familial risk in HC.
Note. Affected white matter tracts by A: Interaction effect of diagnosis × familial risk, ptfce−FWE = 0.036. B: Familial risk in HC. Widespread increased FA in HCr as compared to HClr, ptfce−FWE < 0.001. Effects illustrated on the FMRIB58 template (visualised in green) in the Montreal Neurological Institute (MNI) Atlas coordinate system. Red-yellow areas represent voxels in significant clusters, using the ‘fill’ command in FSL. The colour bar indicates the probability of a voxel being a member of the different labelled regions within the JHU-atlas, averaged over all the voxels in the significant mask (ptfce−FWE < 0.05). MNI coordinates of selected plane for A and B: x = 37, y = −37, z = 7.C: Significant increase in FA in HCr as compared to all other groups. Error bars represent standard errors of the mean. Asterisk represents statistical significance (ptfce−FWE < 0.05) in post-hoc-t-tests. The mean FA value was obtained from FA values of all significant voxels (ptfce−FWE < 0.05). FM, Forceps Minor; IFOF, inferior fronto-occipital fasciculus.

