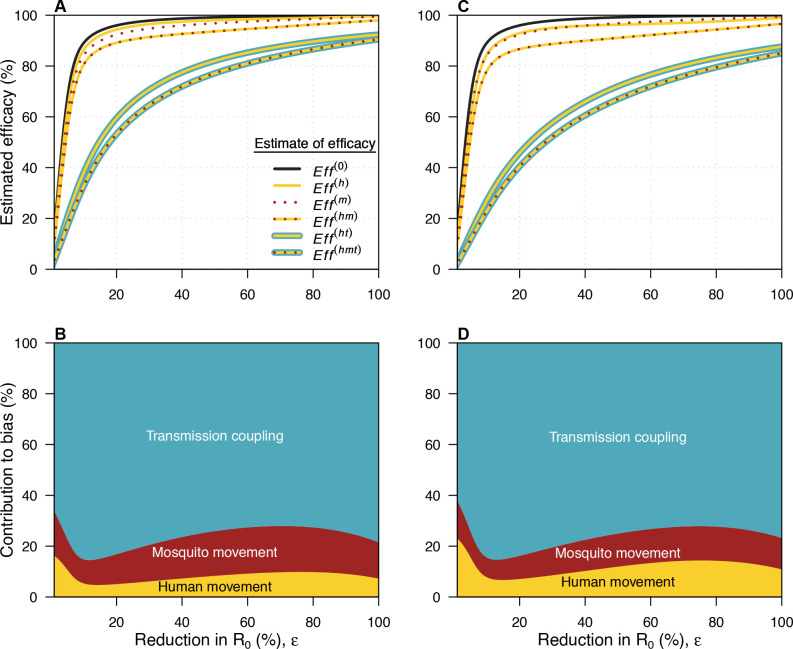
Figure 2.
Sources of bias in efficacy estimates. In all panels, yellow refers to mosquito movement, red to human movement and blue to transmission coupling. (A, B) use the baseline value of b=36.9 m, while (C, D) use a larger value of b=58.4 m. (A) The relationship between the reduction in R0 (ε) and the estimated efficacy for the six possible models. The black line here is the relationship for a model with no human movement or mosquito movement. Where a line has more than one colour, it represents the model which includes each of the types of bias represented by those colours. The difference between this line and each of the coloured lines represents the bias introduced by not accounting for the features present in the model described by that coloured line. (B) The contribution of each source of bias to the total bias. Eff(0) refers to the estimated efficacy from a model with none of the biases, Eff(h) to the estimated efficacy from a model with human movement only, Eff(m) to the estimated efficacy from a model with mosquito movement only, Eff(hm) to the estimated efficacy from a model with human and mosquito movement, Eff(ht) to the estimated efficacy from a model with human movement and transmission coupling, and Eff(hmt) to the estimated efficacy from a model with all three biases. (C, D) As in (A, B) but with b=58.4 m.

