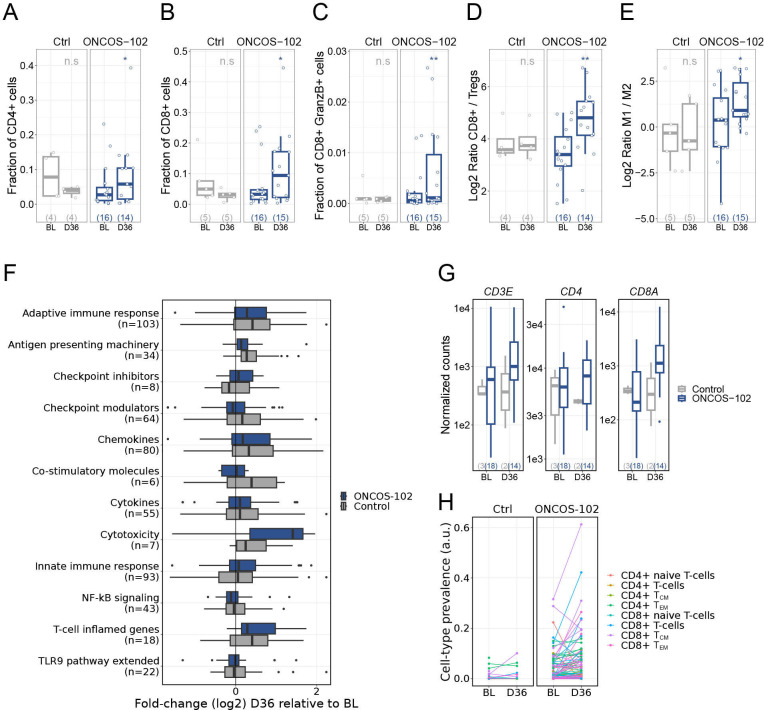
Figure 4.
Change in tumor immune cell profile over time. Immunofluorescence histology for CD4+ (A), CD8+ (B), GranzymeB-positive CD8+ cells (C), CD8+:Treg ratio (D), and M1:M2 (E) for the chemotherapy-alone (left panel) and ONCOS-102 (right panel) groups at baseline and day 36. Boxes show median, lower, and upper quartiles, whiskers show minimum and maximum values within the 1.5 IQR, individual points denote outliers, and values in parentheses denote patients with available samples. P values are derived from quasi-binomial generalized linear model (A–C) or linear regression (D, E). (F) Change in gene expression in select immunological pathways (specified in online supplemental data) from day 36 relative to baseline, stratified by study treatment (number of genes in each pathway are denoted in parentheses). (G) Normalized (using DESeq2) expression of T-cell marker genes at baseline and day 36 stratified by study treatment (values in parentheses denote patients with available samples). (H) Deconvolution of cell-type abundance from transcriptome expression profiles for patients in the chemotherapy-alone (left panel) and ONCOS-102 (right panel) cohorts at baseline and day 36 (colors reflects subsets of CD4+ and CD8+ T-cells). Control is pemetrexed (500 mg/m2) in combination with cisplatin (75 mg/m2) or carboplatin (AUC 5). ONCOS-102 is ONCOS-102 (3×10¹¹ virus particles in 2.5 mL) with pemetrexed (500 mg/m2) in combination with cisplatin (75 mg/m2) or carboplatin (AUC 5). *p≤0.05; **p≤0.01. AUC, area under the concentration–time curve; BL, baseline; D, study day, GM-CSF, granulocyte-macrophage colony stimulating factor; IQR, interquartile range; M, macrophage; TCM, central memory T-cells; TEM, effector memory T-cells; TLR9, toll-like receptor 9; Treg, regulatory T-cells.

