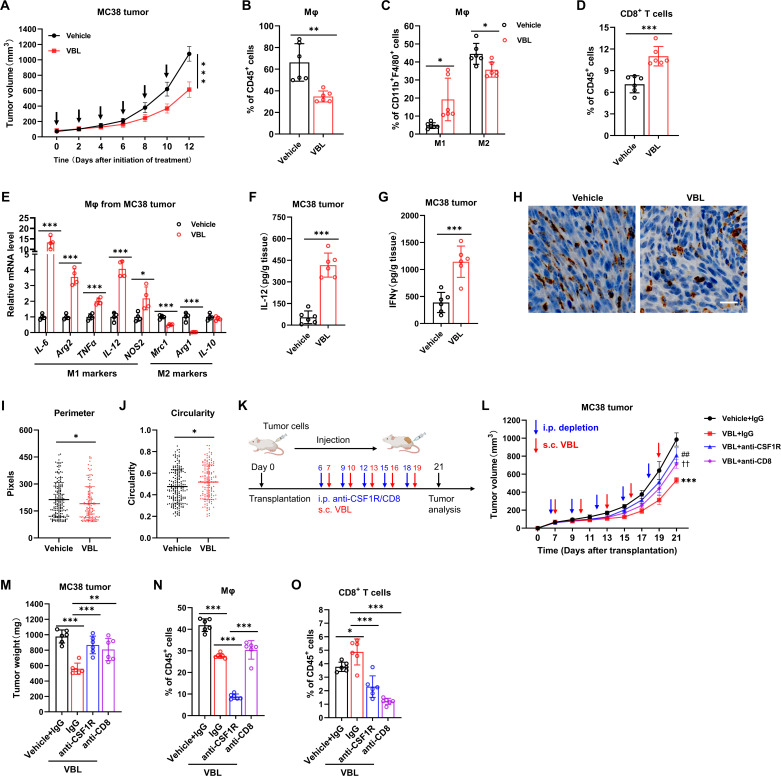
Figure 2.
VBL-mediated antitumor effect is dependent on macrophages and CD8+ T cells. (A) Growth curve of MC38 tumor with and without VBL treatment (1.25 mg/kg weight, every other day), arrows indicate the treatment time. n=6. (B–D) Flow cytometry analysis for total macrophages (B), M1 or M2 cells (C), and T cells (D) in MC38 tumors with or without VBL treatment. n=6. (E) Gene expression of IL-6, Arg2, TNFα, IL-12, NOS2, Mrc1, Arg1, and IL-10 in macrophages sorted from MC38 tumors. n=4. (F–G) ELISA analysis of IL-12 (F) and IFNγ (G) levels in MC38 tumor homogenate. n=6. (H) Representative immunochemistry staining with anti-CD68 antibodies of MC38 tumor samples collected from the vehicle or VBL (1.25 mg/kg weight, every other day for 2 w) treatment. (I–J) Perimeter (I) and circularity (J) of CD68-positive cells in panel (H) were counted. (K) Workflow for VBL treatment with or without T cells (anti-CD8) or macrophage (anti-CSF1R) depletion; s.c., subcutaneously; i.p., intraperitoneally. (L) Growth curve of MC38 tumors during VBL treatment with or without immune cell depletion. n=6. (M) Tumor weight at the end of treatment in panel (L). n=6. (N–O) Flow cytometry analysis for total macrophages (N) and T cells (O) in MC38 tumors after VBL treatment with or without immune cell depletion. n=6. Data are presented as mean±SD. Data in (A, L) were analyzed using a two-way ANOVA with time and treatment type as covariates. *Represents VBL+IgG versus Vehicle+IgG; ##represents VBL+ anti-CSF1R versus VBL+IgG; ††represents VBL+anti-CD8 versus VBL+IgG. Data in (B–K, N–P) were analyzed using a two-tailed Student’s t-test for comparisons. P values were determined by a two-tailed Student’s t-test. *p<0.05, **p<0.01, ***p<0.001. ANOVA, analysis of variance; TAM, tumor-associated macrophage; VBL, vinblastine.

