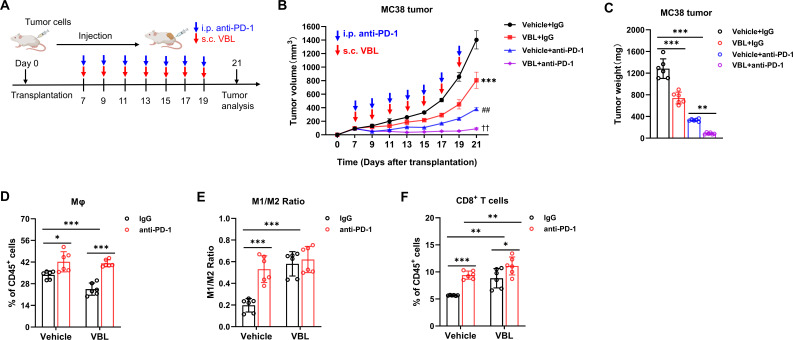
Figure 3.
VBL combined with PD-1 blockade enhances immunotherapy. (A) Schematic experimental workflow for combination treatment; s.c., subcutaneously; i.p., intraperitoneally. (B) Growth curve of MC38 tumors under anti-PD-1 treatment combined with VBL treatment. n=6. (C) Tumor weight at the end of treatment in panel (A). (D–F) Flow cytometry analysis for percentage of total macrophages (D), M1/M2 ratio (E), and percentage of T cells (F) in MC38 tumors after anti-PD-1 treatment combined with VBL treatment. n=6. Data are presented as mean±SD. Data in (B) were analyzed using a two-way ANOVA with time and treatment type as covariates. *Represents VBL+IgG versus vehicle+IgG; ##represents Vehicle+anti-PD-1 versus VBL+IgG; ††represents VBL+anti-PD-1 versus vehicle+anti-PD-1. Data in (C–F) are analyzed using a two-tailed Student’s t-test for comparisons. P values were determined by a two-tailed Student’s t-test. *p<0.05, **p<0.01, ***p<0.001. ANOVA, analysis of variance; VBL, vinblastine.

