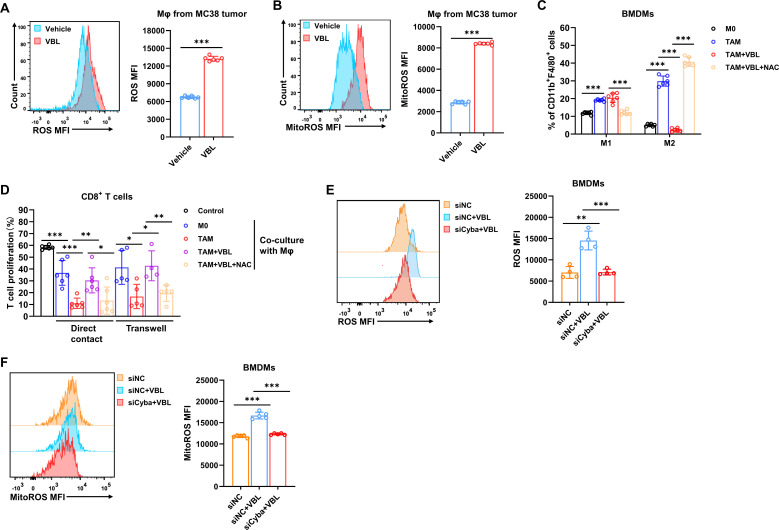
Figure 5.
VBL-induced ROS repolarizes TAMs. (A, B) Flow cytometry analysis of cytosolic ROS (A) and mitoROS (B) levels in macrophages sorted from Vehicle/VBL treated MC38 tumors. n=6. (C) Flow cytometry analysis for percentages of M1 (F4/80+CD11b+CD86+) and M2 (F4/80+CD11b+CD206+) in BMDMs under the corresponding treatment for 24 hours. n=6. (D) T cell proliferation ratio after co-culture with macrophages by direct contact or transwell. n=4–5. (E, F) Flow cytometry analysis of cytosolic ROS (E, n=4) and mitoROS (F, n=5) levels in BMDMs with or without Cyba knockdown. Data are presented as mean±SD. P values were determined by a two-tailed Student’s t-test. *p<0.05, **p<0.01, ***p<0.001. BMDMs, bone marrow-derived macrophages; MFI, mean fluorescence intensity; ROS, reactive oxygen species; VBL, vinblastine.

