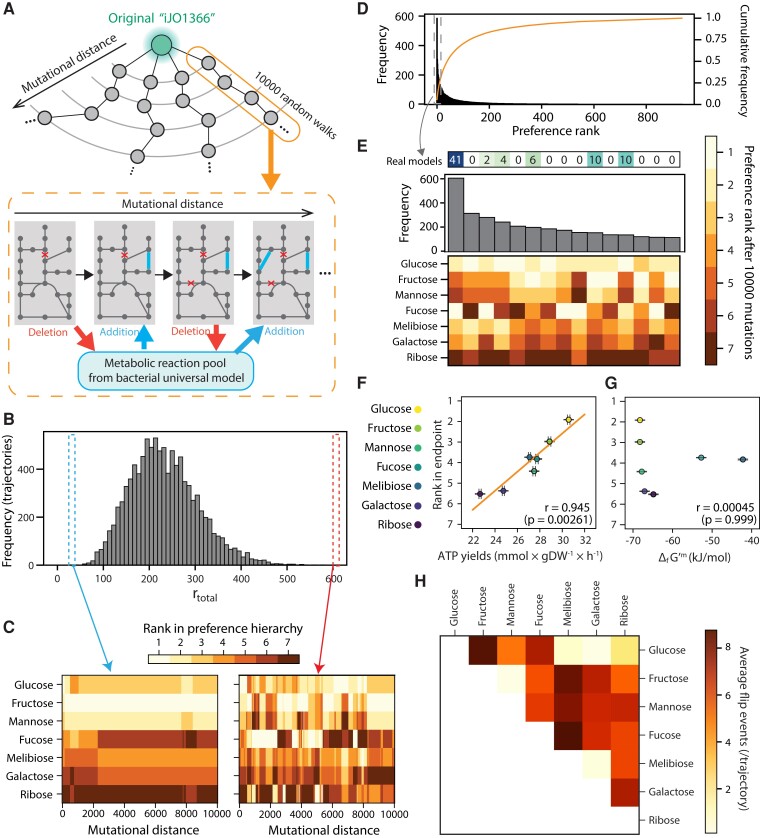
Fig. 1.
Some sugar hierarchies are easier to evolve than others. (A) A schematic of random walk trajectories through genotype space. At each step, a reaction from the model is exchanged by a new reaction from a universal bacterial reaction set (“universal model,” see Materials and Methods). (B) Large variation in metabolic hierarchy rewiring among random walk trajectories. The histogram shows the frequency of total rank flip events (rtotal) during random walks in the 9,974 trajectories. (C) Changes in metabolic hierarchy along an example random-walks trajectory. We show two cases, where the rank swaps rarely (left) or frequently (right) occurred. The preference rank of each sugar at each mutational distance is shown as a heatmap. (D) Convergence of the preference rank to small subsets among all possible preference ranks after random walks. The histogram shows the frequency of each preference rank at the end of the random walks in the 9,974 evolutionary trajectories. The line shows the cumulative distribution of the frequency of preference rank. (E) Zoom of the top 15 most frequent metabolic hierarchies, representing the final point of 3,068 of 9,974 trajectories (histogram), or about ∼30% of the total. We displayed the number of a real organism's models whose preference rank matches each rank configuration. (F) Correlation between the average rank of seven sugars and the average ATP yields at the end of random walks (n = 1,000 genotypes; see Materials and Methods). (G) Correlation between Gibbs free energy of a sugar and the average ranks at the end point in seven sugars. Gibbs free energy was normalized by the number of carbons. In both panels, Pearson's correlations were displayed with P-value obtained using a permutation test (see Materials and Methods). (H) Average number of rank flip events between pairs of sugars during random walks in 9,974 evolutionary trajectories. Sugars are ordered by their initial preference rank in the E. coli model.

