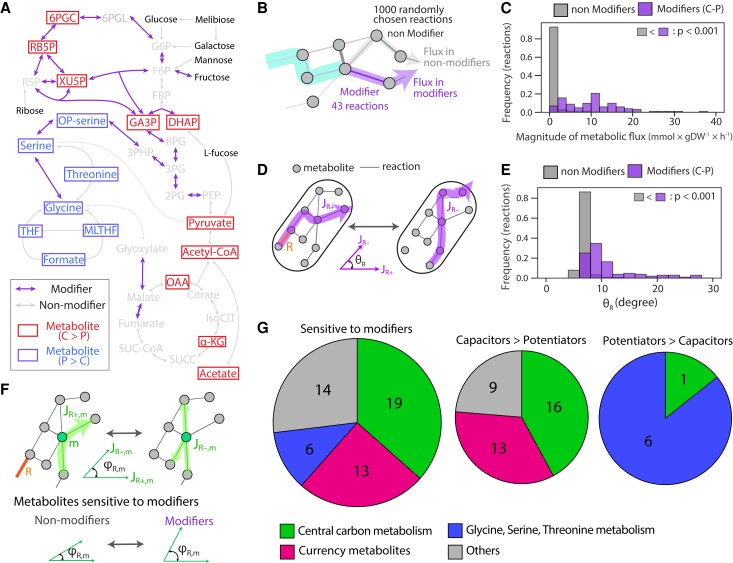
Fig. 4.
Specific reactions and metabolites govern the effects of mutations on resource hierarchies. (A) The locations of evolutionary modifiers and sensitive metabolites to the modifiers in a metabolic network. Here, we mapped them on the central carbon metabolic pathways, that is PPP, glycolysis, glycine/serine/threonine pathway, and TCA cycle, where many of those are involved. Metabolites that were more strongly affected by capacitors or potentiators are colored by red and blue, respectively. (B) and (C) Comparison of magnitude of flux between modifiers and nonmodifiers. We randomly picked out 1,000 evolved models and calculated the average flux carried by 43 reactions screened as modifiers (purple) and randomly chosen 1,000 nonmodifier reactions (gray) across 7 sugars (7301 reaction-sugar pairs). Among those, we selected the pairs working as modifiers (marked with asterisks in fig. 3B, N = 107) and compared them with other pairs (nonmodifier pairs, N = 7,194). Comparison of mean value and statistical significance level were indicated (Wilcoxon rank-sum test). (D) A schematic of “flux sensitivity” analysis. For randomly picked 1,000 evolved models, we added or deleted the target reaction R depending on whether it exists or not. Then, we calculated the cosine similarity of the total flux distribution between presence (JR+) or absence (JR−) of the reaction (θR). Similarly to (B) and (C), we calculated θR of 43 modifiers and 1000 nonmodifiers for each of 7 sugars, and θR is used as the proxy for flux sensitivity for the reaction R on each sugar. (E) Comparison of flux sensitivity (θR) among nonmodifiers (non C-P) or modifiers (C-P). Among 7,301 reaction-sugar pairs, we selected the pairs exhibiting statistically significant effects (marked with asterisks in fig. 3B). Then, we checked whether θR is significantly larger in modifiers than nonmodifiers (Wilcoxon rank-sum test, P-value is shown in the panel). (F) A schematic of flux sensitivity analysis for metabolites. For each metabolite m, influx and efflux to m were analyzed before and after a deletion or addition of a reaction of interest R. Then, cosine similarity between JR+,m, and JR−,m was calculated (φR,m). By comparing φR,m, we screened the metabolites that are significantly more sensitive to the modifiers. (G) Typical metabolites whose flux is sensitive to modifiers. We categorized the screened metabolites, which are sensitive to either capacitors or potentiators (supplementary fig. S9 and supplementary table S1, Supplementary Material online) into four groups: central carbon metabolism (green), currency metabolites (red), glycine/serine/threonine metabolism (blue), and others (gray) and shown its ratio as a pie chart (left pie chart). We also showed the number of metabolites that are more sensitive to capacitors (middle pie chart) or potentiators (right pie chart) in each category.

