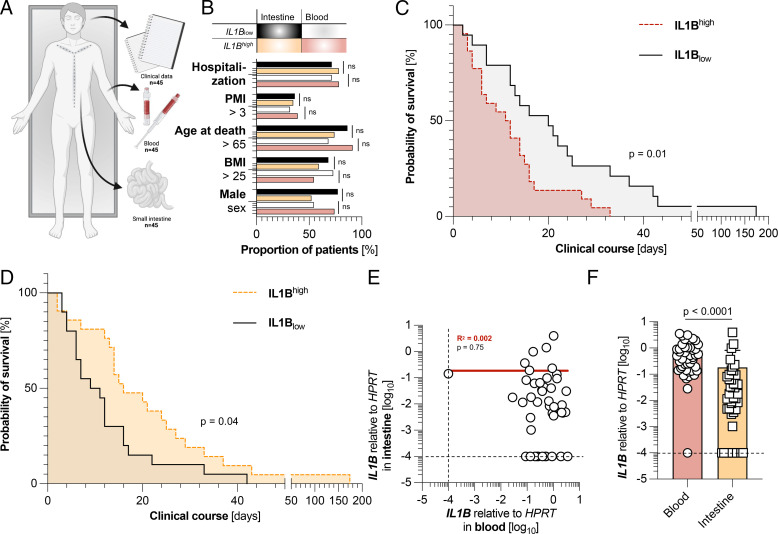
FIGURE 1.
Expression levels of IL1B in the blood and the intestine are associated with inverse survival times. (A) Schematic picture of the data collection process in which clinical data and tissue samples of blood and duodenum were collected from 45 individuals who died of COVID-19. (B) Cohort characteristics of patients with low (below the median) intestinal expression of IL1B (n = 22, black) or high (above the median) intestinal expression of IL1B (n = 23, yellow), as well as low (below the median) expression of IL1B in the blood (n = 22, white) and high (above the median) expression of IL1B in the blood (n = 22, red). One blood sample had to be excluded due to undetectable HPRT values. (C) Kaplan-Meier analysis of survival length in patient cohorts divided according to low (below the median, n = 22, black) and high (above the median, n = 22, red) relative expression of IL1B mRNA in the blood, as measured by RT-PCR. (D) Kaplan-Meier analysis of survival length in patient cohorts divided according to the relative intestinal expression of IL1B (below the median, n = 22, black; above the median, n = 23, yellow). (E) Relative expression of IL1B in the blood in relation to its expression in the intestine in concurrent patient samples (n = 44). Linear regression is shown as a continuous red line. (F) Expression of IL1B in the blood (red, left, n = 44) and in the intestine (yellow, right, n = 45). The dashed black lines represent the limits of detection. The p values were corrected for multiple testing when appropriate. Horizontal lines represent the mean ± SEM; each symbol indicates one sample from one patient.

