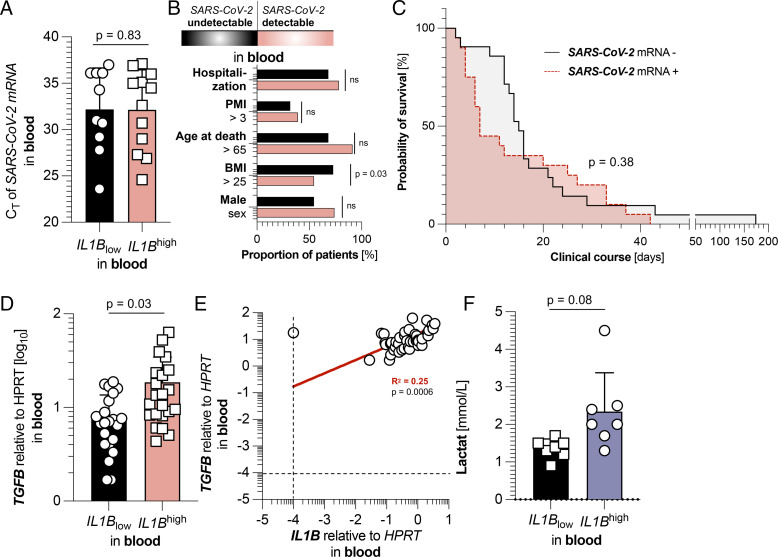
FIGURE 2.
Systemic IL1B is not associated with the systemic viral load but correlates with an enhanced TGFB response. (A) CT values of SARS-CoV-2 mRNA expression in the blood of patients with a detectable SARS-CoV-2 viral load (n = 22), divided according to low (below the median of all 44 patients, black, n = 10) and high (above the median of all 44 patients, red, n = 12) expression of IL1B. (B) Cohort characteristics of patients with undetectable (n = 23, black) and detectable (n = 22, red) SARS-CoV-2 viral loads. (C) Kaplan-Meier analysis of survival length in patient cohorts divided according to undetectability (n = 23, black) and detectability (n = 22, red) of SARS-CoV-2 mRNA in the blood. (D) Relative expression of TGFB in the blood of patients divided according to low (below the median, n = 22, black) and high (above the median, n = 22, red) relative expression of IL1B mRNA in the blood. (E) Relative expression of IL1B in the blood in relation to relative TGFB expression in the blood in concurrent patient samples (n = 44). Linear regression is shown as a continuous red line. The dashed black lines represent the limits of detection. (F) First available lactate levels (in mmol/L, n = 14) upon SARS-CoV-2 diagnosis, determined by screening of patient laboratory findings, divided according to low (below the median of all 44 patients, black, n = 7) and high (above the median of all 44 patients, blue, n = 7) expression of IL1B. The p values were corrected for multiple testing when appropriate. Horizontal lines represent the mean ± SEM; each symbol indicates one sample from one patient.

