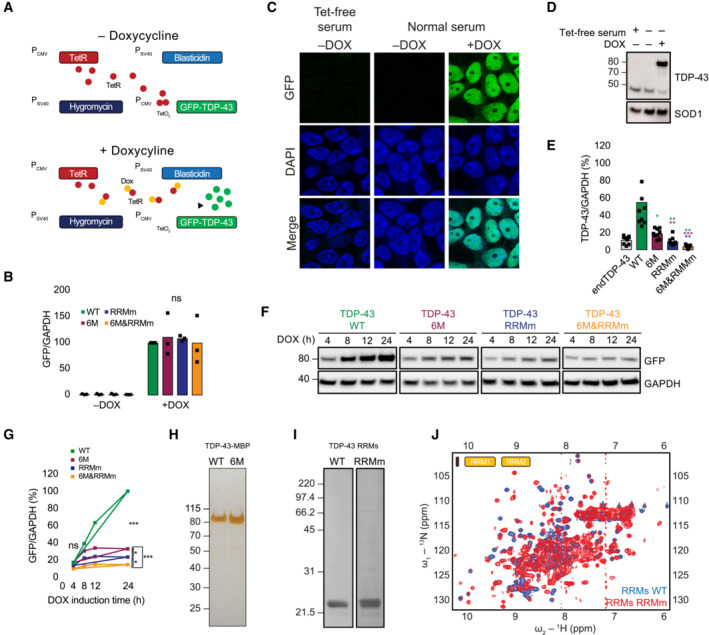
Schematic representation of the Flp‐In T‐Rex system. Dox: doxycycline, GFP: green fluorescent protein, TetR: tetracycline repressor.
RNA levels of the GFP‐TDP‐43 variants after 48 h of expression in the isogenic cell lines measured by qPCR with primers specifically targeted to the GFP sequence. N = 3 independent experiments. Two‐way ANOVA with Tukey's multiple comparisons post hoc test.
Representative image of confocal fluorescence microscopy showing the tight expression regulation of the Flp‐In T‐Rex system, which is unaffected by the residual tetracycline (Tet) present in the regular serum used for the preparation of cell culture medium. Expression of GFP‐TDP‐43 WT is only observable upon addition of doxycycline (DOX) for 48 h. Nuclei are stained with DAPI. Scale bar: 20 μm.
Western blot analysis of the conditions described in (C).
Quantification of the TDP‐43 signal from Fig
1B using a total TDP‐43 antibody, including endogenous TDP‐43 (endTDP‐43) and the four GFP‐TDP‐43 variants.
N = 3 independent experiments. Repeated measures one‐way ANOVA with Greenhouse–Geisser correction and Tukey's multiple comparisons
post hoc test.
Western blot analysis of a time course of the different GFP‐TDP‐43 variant expression upon induction with DOX.
Quantification of the GFP signal from (F). N = 3 independent experiments. Two‐way ANOVA with Tukey's multiple comparisons post hoc test.
Silver‐stained gel showing the purity of 1 μg of the isolated TDP‐43‐MBP variants. (I) Coommasie stained gel showing the purity of the purified TDP‐43 RRM constructs.
Overlay of 2D 1H‐15N HSQC spectra from purified His‐tagged, 15N‐isotopically labeled TDP‐43 RRMs WT (blue) and RRMm RRMs (red). The presence of dispersed peaks in the spectra indicates that both WT and RRMm RRMs are folded, and are compatible with the formation of α‐helix and β‐strand structures. In case of unfolding, all 1H NMR signals would pool around 8 ppm. ns: not significant, *P < 0.05, **P < 0.01, ***P < 0.001. Graph bars represent mean ± SD.

