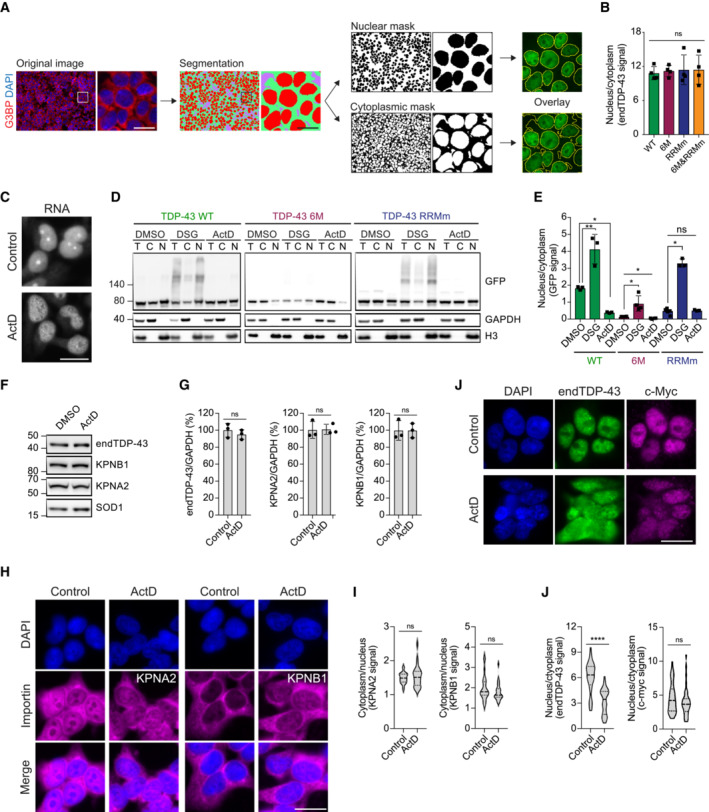
Schematic of the pipeline for the quantification of nuclear and cytoplasmic GFP‐TDP‐43 fluorescence levels with the Fiji plug‐in Trainable Weka Segmentation. Scale bar: 20 μm.
Quantification of endogenous TDP‐43 (endTDP‐43) signal from Fig
2D.
N = 3 independent experiments. Repeated measures one‐way ANOVA with Greenhouse–Geisser correction and Tukey's multiple comparisons
post hoc test. ns: not significant. Graph bars represent mean ± SD.
Representative images of widefield fluorescence microscopy of HEK293 cells treated with ActD showing the total RNA pattern. Note the absence of rRNA staining in the nucleoli upon ActD treatment indicating that RNA transcription has been halted. Scale bar: 20 μm.
After expression of GFP‐TDP‐43 (WT, 6M or RBDm) for 48 h, the cell lines were treated with 5 μg/ml ActD for 4 h to inhibit transcription or DSG to cross‐link protein–protein interactions before performing nucleocytoplasmic fractionation and western blot analysis. Note how the fractionation of the RNA‐binding mutant GFP‐TDP‐43 (RRMm) resembles that of ActD‐treated GFP‐TDP‐43 WT, and how the stabilization of TDP‐43 oligomerization through DSG cross‐link does not affect the localization of oligomerization‐deficient GFP‐TDP‐43 as much as it does for the oligomerization‐competent GFP‐TDP‐43 WT.
Quantification of the GFP signal from (D). N = 3 independent experiments. Repeated measures one‐way ANOVA with Tukey's multiple comparisons post hoc test.
Expression of the importins involved in the nuclear translocation of TDP‐43 (KPNA2 and KPNB1) was analyzed in HEK293 cells by western blot upon treatment with 5 μg/ml ActD for 4 h.
Quantification of the endogenous TDP‐43 (endTDP‐43), KPNA2, and KPNB1 signal from (E). Repeated measures one‐way ANOVA with Greenhouse–Geisser correction and Dunnett's multiple comparisons post hoc test. (H) Representative images of widefield fluorescence microscopy of HEK293 cells treated with 5 5 μg/ml ActD for 4 h showing the distribution of KPNA2 and KPNB1. Scale bar: 20 μm.
Quantification of the nucleocytoplasmic distribution of KPNA2 and KPNB1 in the immunocytochemistry images shown in (H). N = 25 cells. Unpaired two‐tailed t‐test.
Representative images of widefield fluorescence microscopy of HEK293 cells treated with 5 μg/ml ActD for 4 h showing the distribution of c‐myc, a non‐RNA‐binding cargo of the KPNA2/KPNB1 complex. Scale bar: 20 μm.
Quantification of the endogenous TDP‐43 (endTDP‐43) and c‐myc levels in the immunocytochemistry images shown in (I). N = 40 cells. Mann–Whitney U‐test. Nuclei are stained with DAPI in (A, H and J). Ns: not significant, *P < 0.05, **P < 0.01, ****P < 0.0001. Graph bars represent mean ± SD. Violin plots show mean and quartiles.

