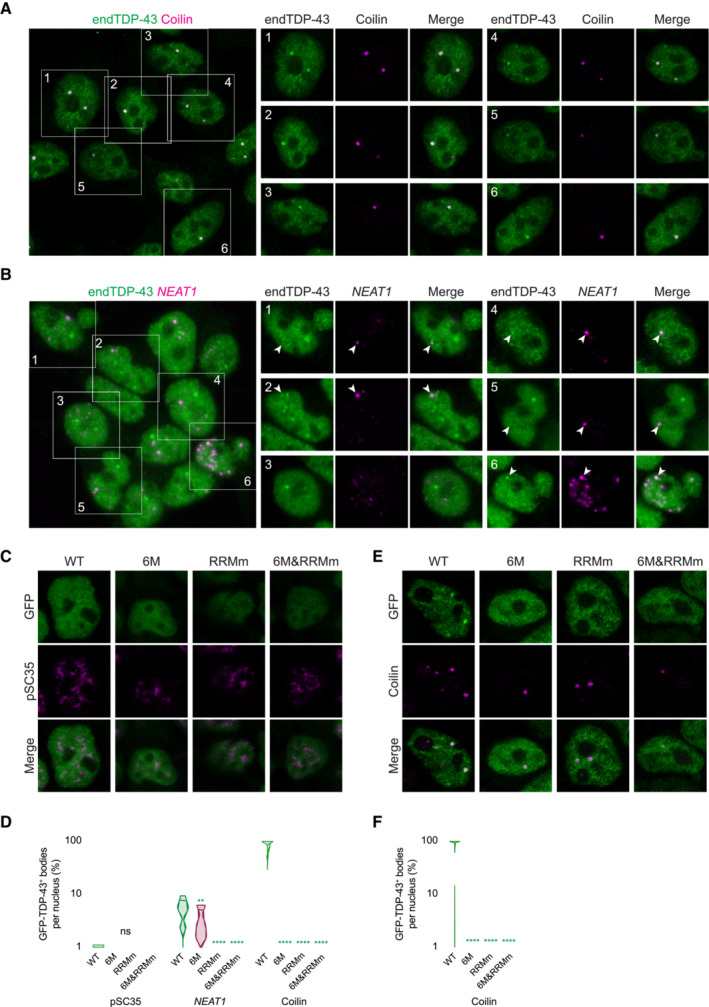
Figure EV5. Nuclear TDP‐43 droplets do not localize to nuclear speckles.

- Representative confocal microscopy images of HEK293 cells stained for the Cajal body marker coilin. Scale bar: 10 μm (5 μm for insets).
- Representative confocal microscopy images of HEK293 cells hybridized with a fluorescent NEAT1 probe to mark the paraspeckles. The field overview is shown as a maximum intensity Z‐projection (thickness of ~10 μm, in steps of 0.21 μm). Scale bar: 10 μm (5 μm for insets).
- Representative confocal microscopy images of the isogenic HEK293 lines expressing the different GFP‐TDP‐43 variants for 24 h and stained for the nuclear speckle marker pSC35.
- Representative confocal microscopy images of the isogenic HEK293 lines expressing the different GFP‐TDP‐43 variants for only 4 h to achieve similar expression levels and stained for the Cajal body marker coilin.
- 3D analysis quantification showing the percentage of Cajal bodies that colocalize with each of the GFP‐TDP‐43 variants as shown in (E). N = 39–54 cells. Kruskal‐Wallis test with Dunn's multiple comparisons post hoc test. ns: not significant, **P < 0.01, ****P < 0.0001. Violin plots show mean and quartiles.
