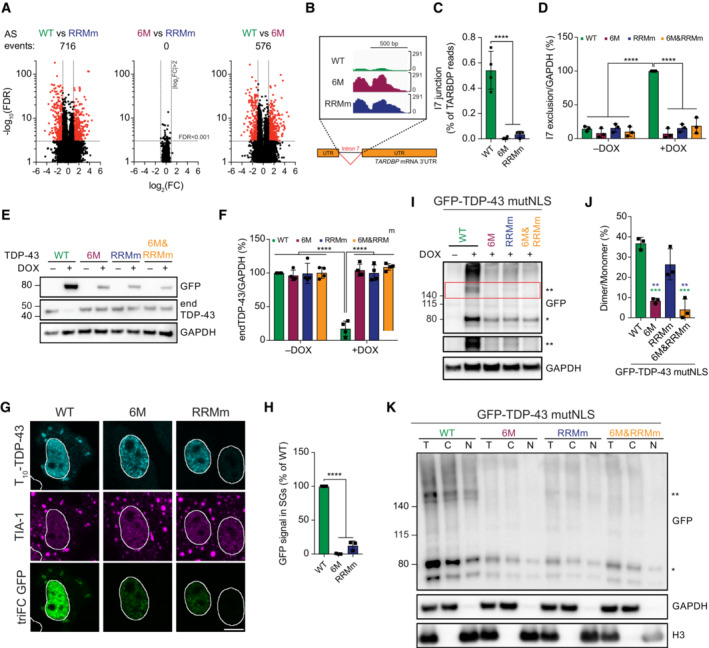
Figure 6. TDP‐43 oligomerization is required for splicing regulation in the nucleus and stress granule incorporation in the cytoplasm.

- Volcano plots showing alternative splicing (AS) events upon expression of GFP‐TDP‐43 variants for 48 h.
- RNA sequencing (RNA‐seq) coverage across the intron 7 of the TARDBP gene, showing a strong decrease in the WT, but not the mutant, GFP‐TDP‐43‐expressing cells.
- Quantification of RNA‐seq reads spanning the intron 7 junction. One‐way ANOVA with Tukey's multiple comparisons post hoc test.
- Endogenous TDP‐43 (endTDP‐43) intron 7 exclusion levels after expression of the GFP‐TDP‐43 variants for 48 h in the isogenic cell lines measured by qPCR with primers specifically targeted to the transcripts excluding this region. N = 3 independent experiments. Two‐way ANOVA with Tukey's multiple comparisons post hoc test.
- Western blot analysis of the isogenic HEK293 after GFP‐TDP‐43 expression for 48 h showing that only the WT variant regulates endTDP‐43 levels.
- Quantification of the endTDP‐43 signal from (E). N = 4 independent experiments. Two‐way ANOVA with Tukey's multiple comparisons post hoc test.
- Tripartite GFP complementation assay involving the co‐transfection of a pair of N‐terminally T10‐ and T11‐tagged TDP‐43 constructs in HeLa cells subjected to arsenite stress for 30 min and incubated with recombinant GFP1–9 after fixation to label T10‐ and T11‐TDP‐43 dimers. TriFC: trimolecular fluorescence complementation. Scale bar: 10 μm.
- Quantification of the trimolecular fluorescence complementation (triFC) signal of GFP in the TIA‐1‐marked SGs from the images shown in (G). N = 3 independent experiments. Repeated measures one‐way ANOVA with Greenhouse–Geisser correction and Tukey's multiple comparisons post hoc test.
- Expression of GFP‐TDP‐43 mutNLS variants was induced with doxycycline (DOX) for 4 h before crosslinking protein–protein interactions with DSG and subsequent analysis by western blot. * and ** indicate GFP‐TDP‐43 monomers and dimers, respectively.
- Quantification of the GFP signal from (I). N = 3 independent experiments. Repeated measures one‐way ANOVA with Greenhouse–Geisser correction and Tukey's multiple comparisons post hoc test.
- After expression of GFP‐TDP‐43 mutNLS variants for 48 h, the isogenic lines were treated with DSG to cross‐link protein–protein interactions before performing nucleocytoplasmic fractionation and western blot analysis. * and ** indicate GFP‐TDP‐43 monomers and dimers, respectively. **P < 0.01, ***P < 0.001, ****P < 0.001. Graph bars represent mean ± SD.
Source data are available online for this figure.
